Full Report
Figures converted from IDR to USD at historical FX rates (frankfurter.app). Monetary statements are shown in US$ millions; per-share figures use the matching period rate. Filing links open the native figures from which each USD value was derived.
The numbers behind PT Cipta Perdana Lancar Tbk: as-reported financial statements and company metrics for FY2021–FY2025, traced to the source filings, opened with the share-price history those statements have to justify. Every linked USD figure opens the exact filing row containing the native reported value from which it was converted. Amounts in US$ millions unless noted.
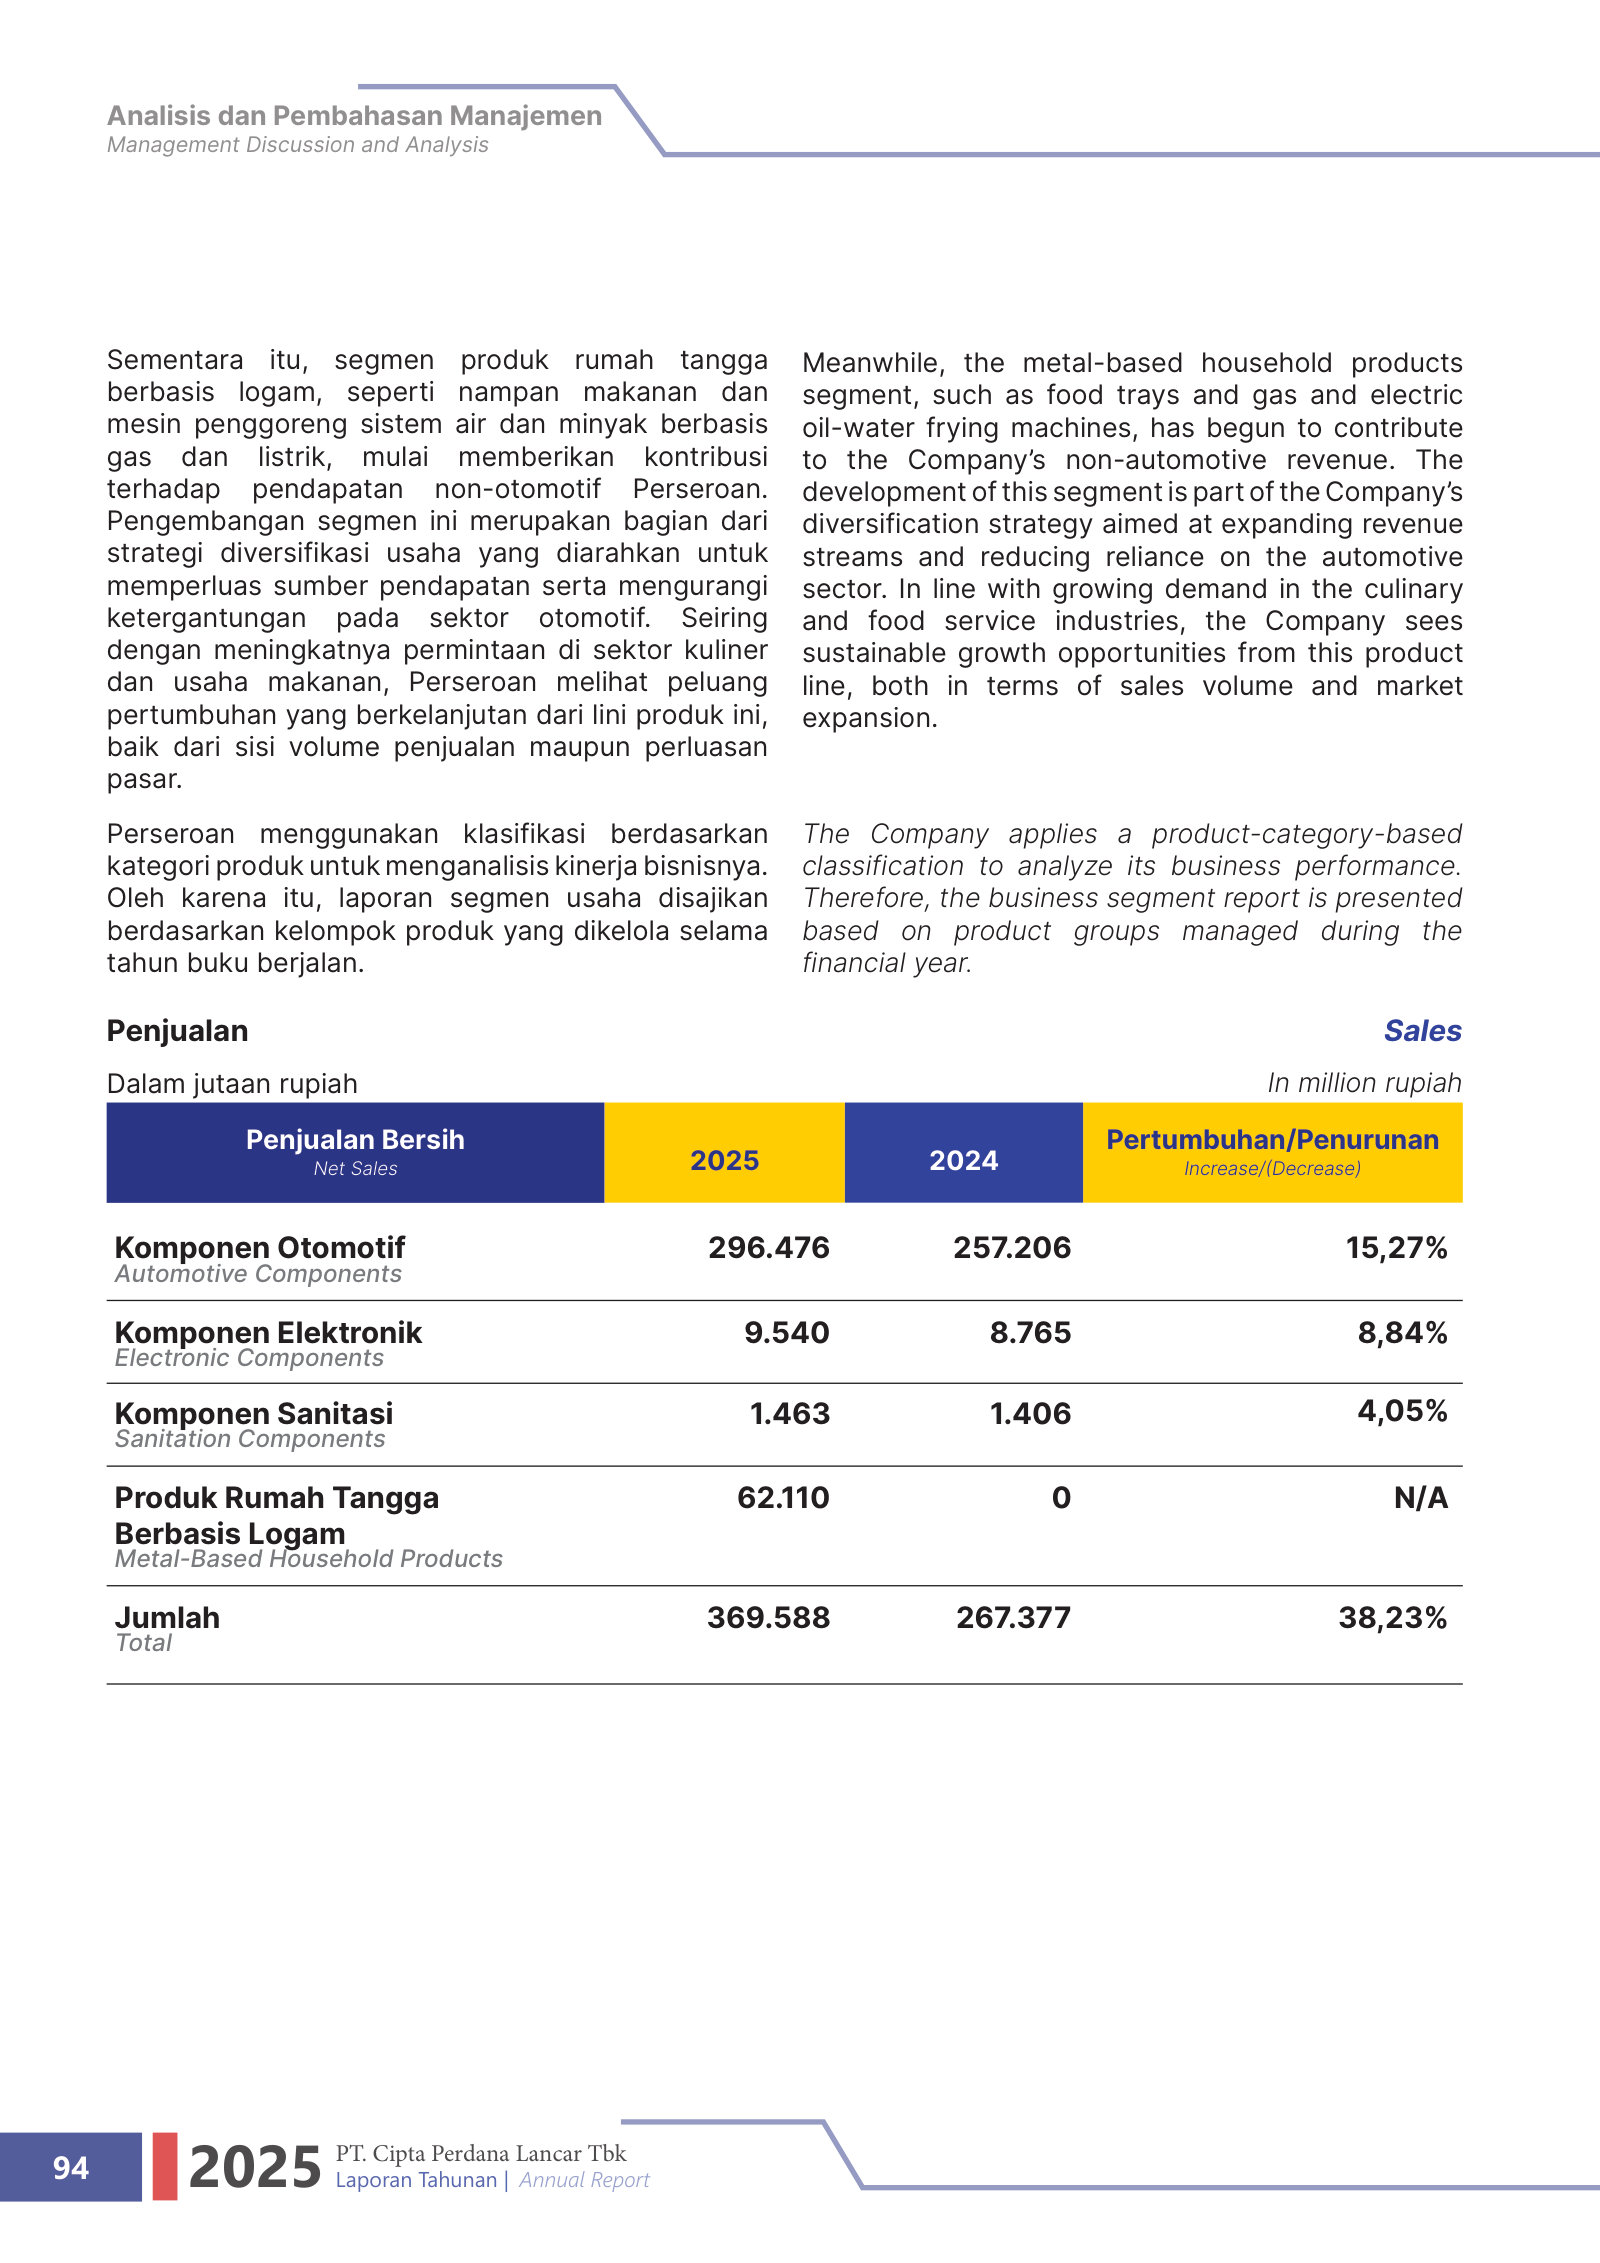
Reading notes: All figures are in full Indonesian Rupiah (Rp) exactly as printed in the audited financial statements, which state 'Disajikan dalam Rupiah, kecuali dinyatakan lain' (Expressed in Rupiah, unless otherwise stated). FY2023, FY2024 and FY2025 figures are page-linked to the audited financial statements. FY2024 figures are cited from the FY2025 annual report's comparative column; FY2023 figures from the FY2024 annual report's comparative column. FY2021 and FY2022 figures are from the standardized data feed (sourced from the June-2024 IPO prospectus / stockanalysis.com) and are shown without page links, as the corpus contains no filing covering those years. Segment, cost, and balance-sheet detail is unavailable for FY2021/FY2022, so those cells are blank. The company reports revenue in three product segments through FY2024 (Automotive, Electronics, Cleaning facilities) and added a fourth, Household appliances, in FY2025 (Rp 62.1 billion) — the diversification highlighted in the FY2025 report.
Share Price — Available History Since July 2025
The stock closed at $0.01 on Jul 17, 2026 — down 14% over the window shown, trading between $0.00 and $0.01.
Source: market price feed, daily closes, Jul 2025–Jul 2026 — the feed marks this available history as partial. Price return only, excludes dividends. Prices converted from IDR to USD with date-matched or nearest-available FX.
FY2025 at a Glance
Operating income (US$ millions)
Net income (US$ millions)
Source: FY2025 consolidated statements [1] [2] [3]. Click any linked figure to open the filing page with the row highlighted.
Sales by Product Segment
| Sales by Product Segment | FY2021 | FY2022 | FY2023 | FY2024 | FY2025 |
|---|---|---|---|---|---|
| Automotive | — | — | 15 | 16 | 18 |
| Electronics | — | — | 0 | 1 | 1 |
| Cleaning facilities | — | — | 0 | 0 | 0 |
| Household appliances | — | — | — | — | 4 |
| Total sales | — | — | 15 | 17 | 22 |
Source: Notes to the Financial Statements — Operation Segment (Note 32 FY2025 / Note 30 FY2024); segment mix reported by product line [4] [5] [6]. Click any linked figure to open the filing page with the row highlighted.
Gross Profit by Product Segment
| Gross Profit by Product Segment | FY2021 | FY2022 | FY2023 | FY2024 | FY2025 |
|---|---|---|---|---|---|
| Automotive | — | — | 3 | 3 | 3 |
| Electronics | — | — | 0 | 0 | 0 |
| Cleaning facilities | — | — | 0 | 0 | 0 |
| Household appliances | — | — | — | — | 1 |
| Total gross profit | — | — | 3 | 4 | 4 |
Source: Notes to the Financial Statements — Operation Segment (Note 32 FY2025 / Note 30 FY2024) [4] [5] [6]. Click any linked figure to open the filing page with the row highlighted.
Income Statement
| Income Statement | FY2021 | FY2022 | FY2023 | FY2024 | FY2025 |
|---|---|---|---|---|---|
| Sales | 9 | 12 | 15 | 17 | 22 |
| Cost of goods sold | — | — | (12) | (13) | (18) |
| Gross profit | — | — | 3 | 4 | 4 |
| General and administrative expenses | — | — | (2) | (2) | (2) |
| Operating profit | 1 | 1 | 2 | 2 | 2 |
| Finance income | — | — | 0 | 0 | 0 |
| Other income (expenses) - net | — | — | 0 | 1 | 1 |
| Finance costs | — | — | (1) | (1) | (1) |
| Profit before income tax | 1 | 1 | 1 | 2 | 2 |
| Income tax expense | — | — | (0) | (0) | (1) |
| Net profit for the year | 0 | 1 | 1 | 1 | 2 |
| Basic earnings per share | — | — | — | 0.00 | 0.00 |
| Weighted average shares outstanding | — | — | — | 2,374,426,230.0 | 2,721,802,769.0 |
Source: Statements of Profit or Loss and Other Comprehensive Income [1] [2] [3]. Click any linked figure to open the filing page with the row highlighted.
Balance Sheet
| Balance Sheet | FY2021 | FY2022 | FY2023 | FY2024 | FY2025 |
|---|---|---|---|---|---|
| Cash on hand and in banks | 0 | 0 | 0 | 3 | 0 |
| Trade receivables - third parties | — | — | 2 | 2 | 2 |
| Inventories | — | — | 2 | 2 | 4 |
| Total current assets | 4 | 5 | 4 | 8 | 7 |
| Fixed assets - net | — | — | 9 | 10 | 13 |
| Total assets | 6 | 12 | 14 | 19 | 20 |
| Total current liabilities | 2 | 4 | 4 | 3 | 3 |
| Long-term bank loans - non-current | 1 | 4 | 6 | 6 | 6 |
| Total liabilities | 4 | 9 | 10 | 9 | 9 |
| Total equity | 2 | 3 | 4 | 10 | 11 |
Source: Statements of Financial Position [7] [8] [9] [3]. Click any linked figure to open the filing page with the row highlighted.
Cash Flow
| Cash Flow | FY2021 | FY2022 | FY2023 | FY2024 | FY2025 |
|---|---|---|---|---|---|
| Net cash provided by operating activities | — | — | 2 | 1 | 1 |
| Acquisition of fixed assets | — | — | (3) | (2) | (4) |
| Net cash used for investing activities | — | — | (3) | (2) | (4) |
| Proceeds from long-term bank loans | — | — | 5 | 1 | 2 |
| Dividend payment | — | — | — | — | (0) |
| Net cash provided by financing activities | — | — | 1 | 4 | 0 |
| Net (decrease) increase in cash | — | — | (0) | 3 | (3) |
Source: Statements of Cash Flows [10] [11]. Click any linked figure to open the filing page with the row highlighted.
Key Ratios (as reported)
| Key Ratios (as reported) | FY2021 | FY2022 | FY2023 | FY2024 | FY2025 |
|---|---|---|---|---|---|
| Gross profit margin | — | — | 20.2% | 21.9% | 19.1% |
| Operating profit margin | — | — | 10.1% | 11.7% | 11.0% |
| Net profit margin | — | — | 6.7% | 8.7% | 8.2% |
| Return on equity | — | — | 25.2% | 14.9% | 16.3% |
| Current ratio | — | — | 1.2 | 2.6 | 2.5 |
| Debt-to-equity ratio | — | — | 248.4% | 92.5% | 81.6% |
| Debt-to-EBITDA | — | — | 3.1 | 2.2 | 1.8 |
Source: company filings [12]. Click any linked figure to open the filing page with the row highlighted.
Customer Concentration
| Customer Concentration | FY2021 | FY2022 | FY2023 | FY2024 | FY2025 |
|---|---|---|---|---|---|
| Badan Gizi Nasional (MBG free-meals program) | — | — | — | — | 4 |
| PT Chemco Harapan Nusantara | — | — | — | 2 | 2 |
| Combined customers above 10% of revenue | — | — | — | 2 | 6 |
| Sales to related parties | — | — | — | 0 | 0 |
Source: company filings [13] [14]. Click any linked figure to open the filing page with the row highlighted.
Workforce Scale
| Workforce Scale | FY2021 | FY2022 | FY2023 | FY2024 | FY2025 |
|---|---|---|---|---|---|
| Total employees | — | — | — | 239 | 336 |
| Production operators technicians | — | — | — | 195 | 283 |
| Permanent employees | — | — | — | 20 | 25 |
| Non-permanent (contract) employees | — | — | — | 219 | 311 |
Source: company filings [15] [16]. Click any linked figure to open the filing page with the row highlighted.
Production Cost Structure
| Production Cost Structure | FY2021 | FY2022 | FY2023 | FY2024 | FY2025 |
|---|---|---|---|---|---|
| Raw materials consumed | — | — | — | 8 | 14 |
| Direct labor wages | — | — | — | 2 | 2 |
| Factory overhead | — | — | — | 2 | 3 |
| Depreciation in cost of production | — | — | — | 0 | 1 |
| Finished-goods inventory (year-end) | — | — | — | 0 | 3 |
Source: company filings [13] [17]. Click any linked figure to open the filing page with the row highlighted.
Ownership Capital Returns
| Ownership Capital Returns | FY2021 | FY2022 | FY2023 | FY2024 | FY2025 |
|---|---|---|---|---|---|
| Controlling shareholder — PT Cipta Investama Lancar | — | — | — | 55.0% | 54.6% |
| Founder direct stake — Hamim | — | — | — | 10.0% | 9.9% |
| Public float | — | — | — | 25.0% | 25.6% |
| Cash dividend per share | — | — | — | — | 0.00 |
Source: company filings [18] [19]. Click any linked figure to open the filing page with the row highlighted.
Long-Term Record
| Fiscal year | Total revenue | Operating profit | Net profit for the year | Net cash from operating activities | Total equity |
|---|---|---|---|---|---|
| FY2021 | 9 | 1 | 0 | — | 2 |
| FY2022 | 12 | 1 | 1 | — | 3 |
| FY2023 | 15 | 2 | 1 | 2 | 4 |
| FY2024 | 17 | 2 | 1 | 1 | 10 |
| FY2025 | 22 | 2 | 2 | 1 | 11 |
Source: consolidated statements across filings; older years from the standardized feed [10] [2] [7] [11]. Click any linked figure to open the filing page with the row highlighted.
Analyst Consensus
Street ratings: No sell-side analyst coverage. PT Cipta Perdana Lancar Tbk (IDX: PART / PART.JK) is covered by 0 analysts per Yahoo Finance, Simply Wall St, and Investing.com. There is no consensus price target and no buy/hold/sell rating distribution available. The price-target mean of 0 is a placeholder indicating "not available," not an actual target.
Estimate source: analyst consensus (claude_web), as of 2026-07-19. Forecasts carry no filing page links.
Traceability
180 of 210 figures on this page (86%) link to the filing page containing the native reported figure from which the USD value was converted — click a linked figure to open that source row. Unlinked figures come from standardized data feeds or pre-filing years.
All figures are in full Indonesian Rupiah (Rp) exactly as printed in the audited financial statements, which state 'Disajikan dalam Rupiah, kecuali dinyatakan lain' (Expressed in Rupiah, unless otherwise stated).
FY2023, FY2024 and FY2025 figures are page-linked to the audited financial statements. FY2024 figures are cited from the FY2025 annual report's comparative column; FY2023 figures from the FY2024 annual report's comparative column.
FY2021 and FY2022 figures are from the standardized data feed (sourced from the June-2024 IPO prospectus / stockanalysis.com) and are shown without page links, as the corpus contains no filing covering those years. Segment, cost, and balance-sheet detail is unavailable for FY2021/FY2022, so those cells are blank.
The company reports revenue in three product segments through FY2024 (Automotive, Electronics, Cleaning facilities) and added a fourth, Household appliances, in FY2025 (Rp 62.1 billion) — the diversification highlighted in the FY2025 report.
The company reports only basic EPS. It computes it on total comprehensive income (not net profit) over weighted-average shares; pre-IPO years are not comparable due to the 2024 stock split (par value changed from Rp 1,000 to Rp 25), so EPS is shown for FY2024–FY2025 only.
3 figure(s) differed between the data feed and the filing; the filing value is shown (see the run's metrics/metrics_tab.json for the audit trail).
PT Cipta Perdana Lancar Tbk's management explains the business in its own materials. The slides below do the most of that work, pulled from the documents preserved in Sources. Each source link opens the complete presentation at that slide in a new tab.
Annual Report 2025 — Company Profile — FY2025
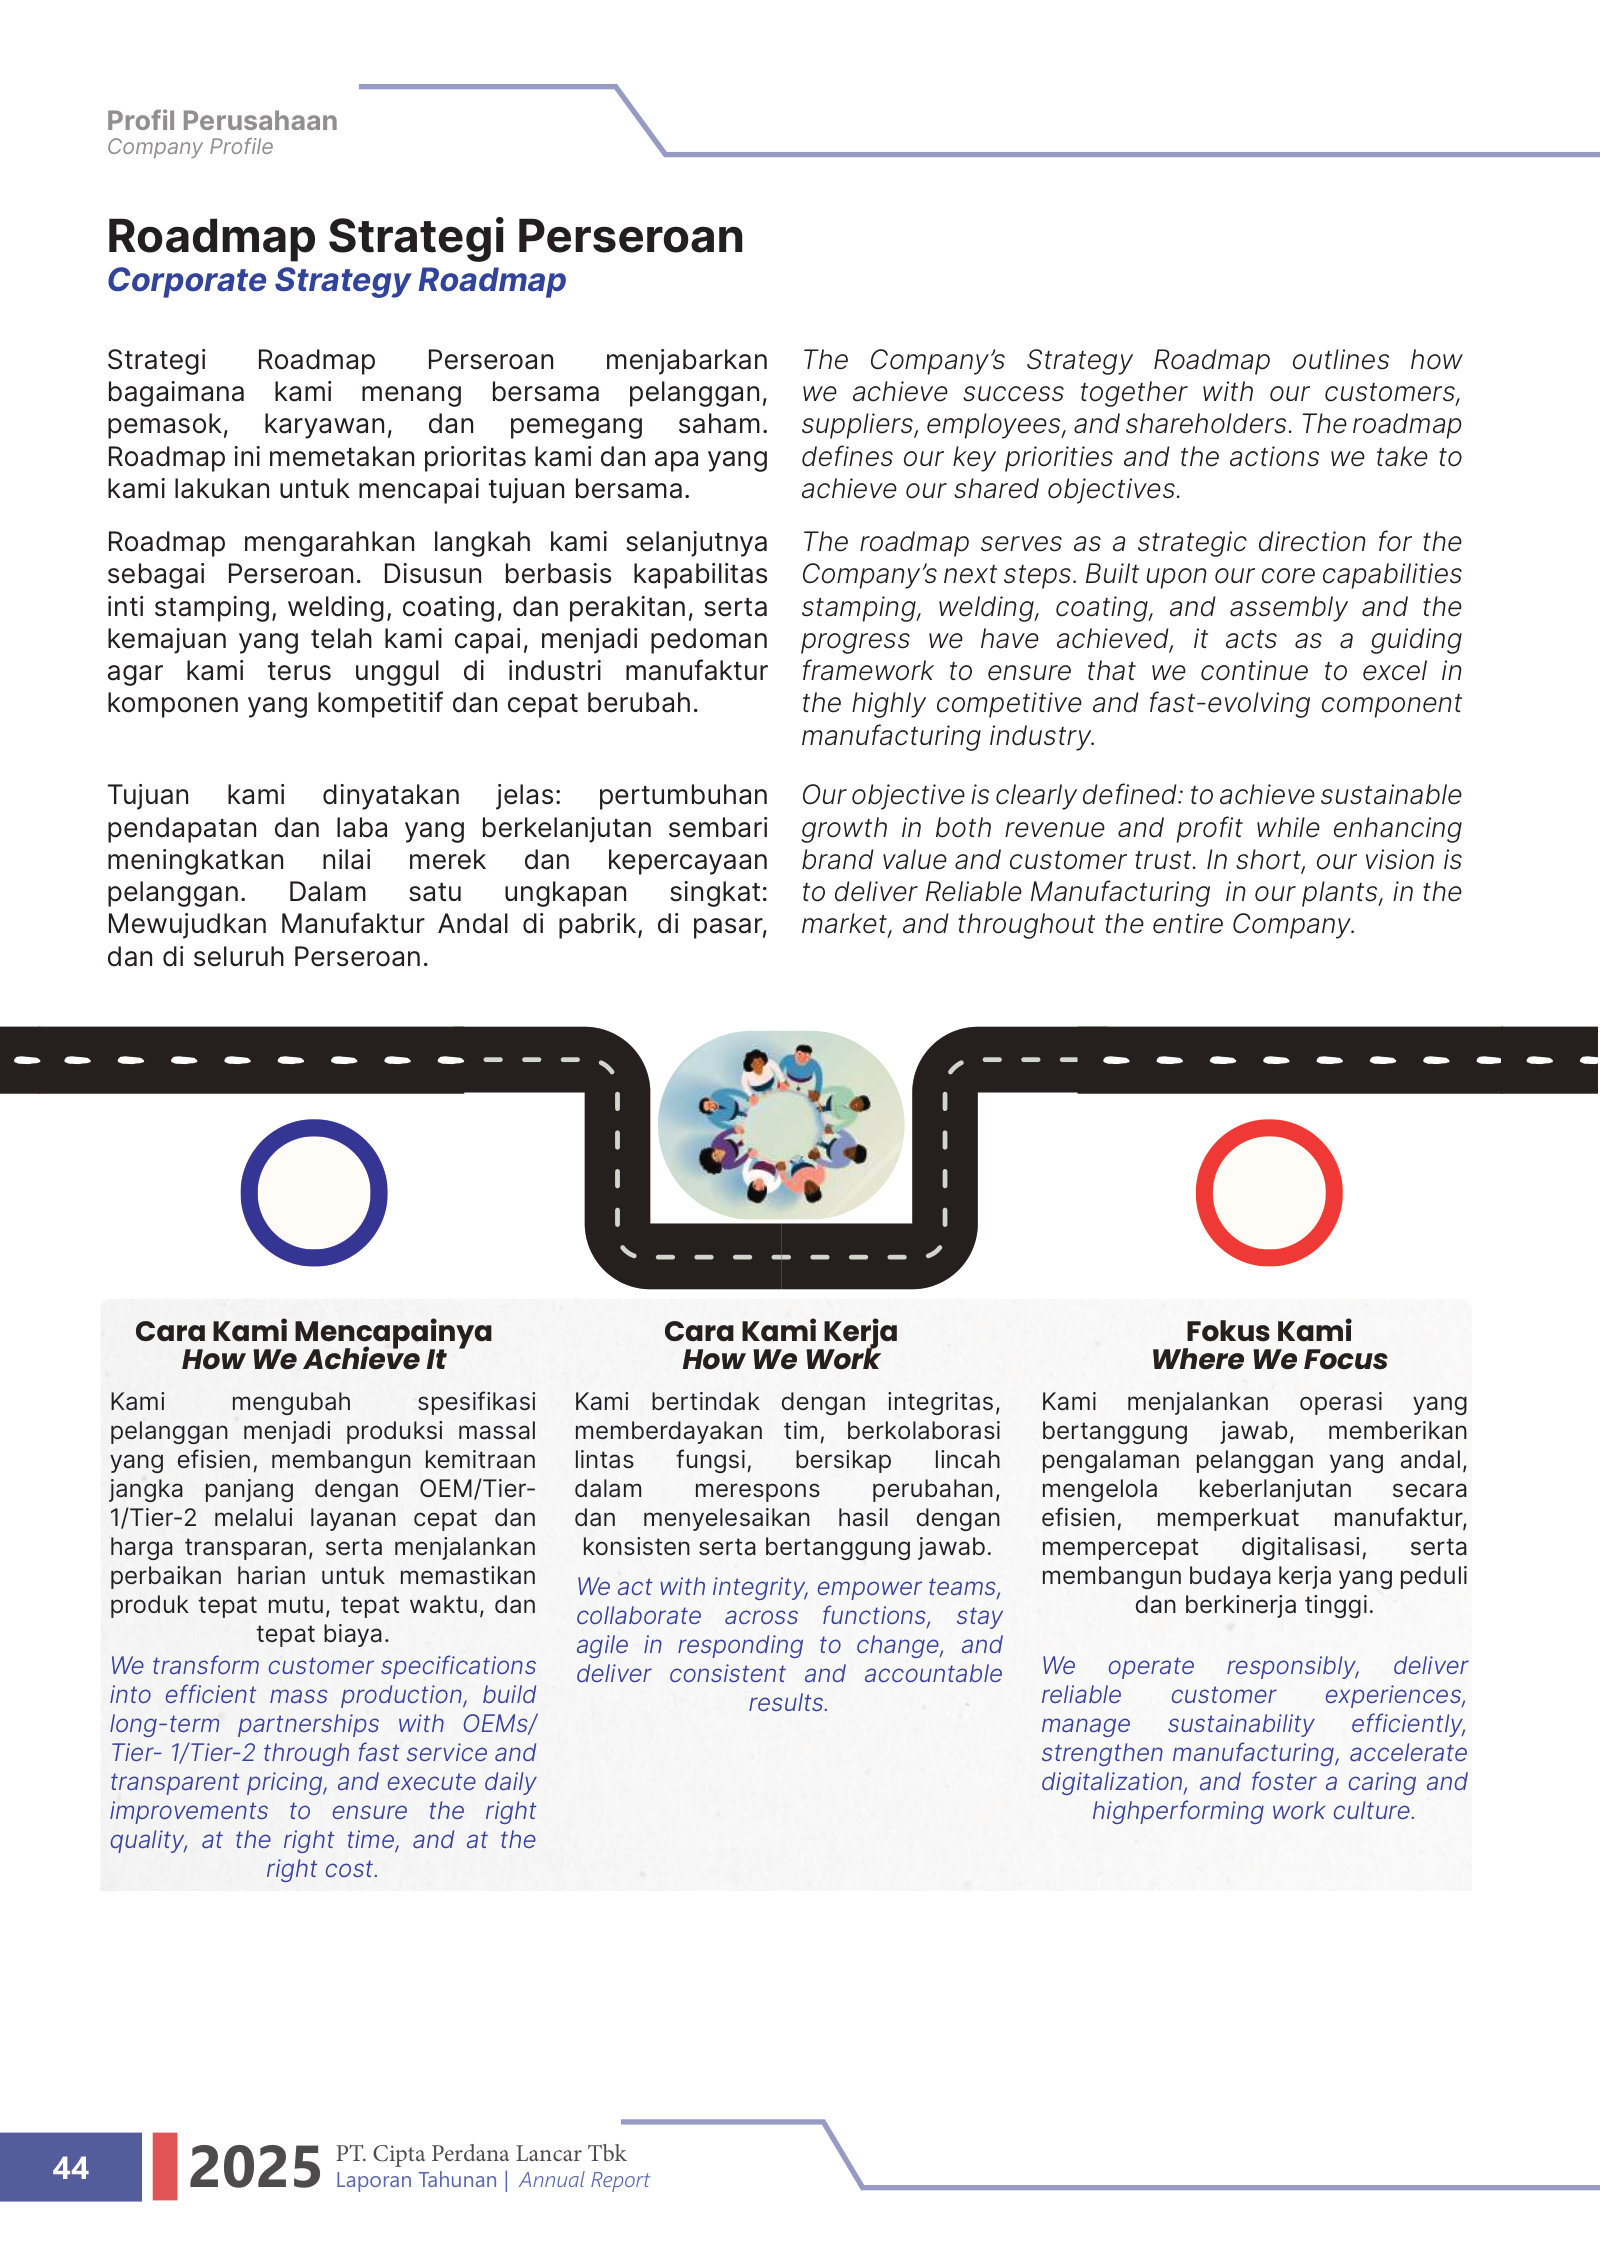
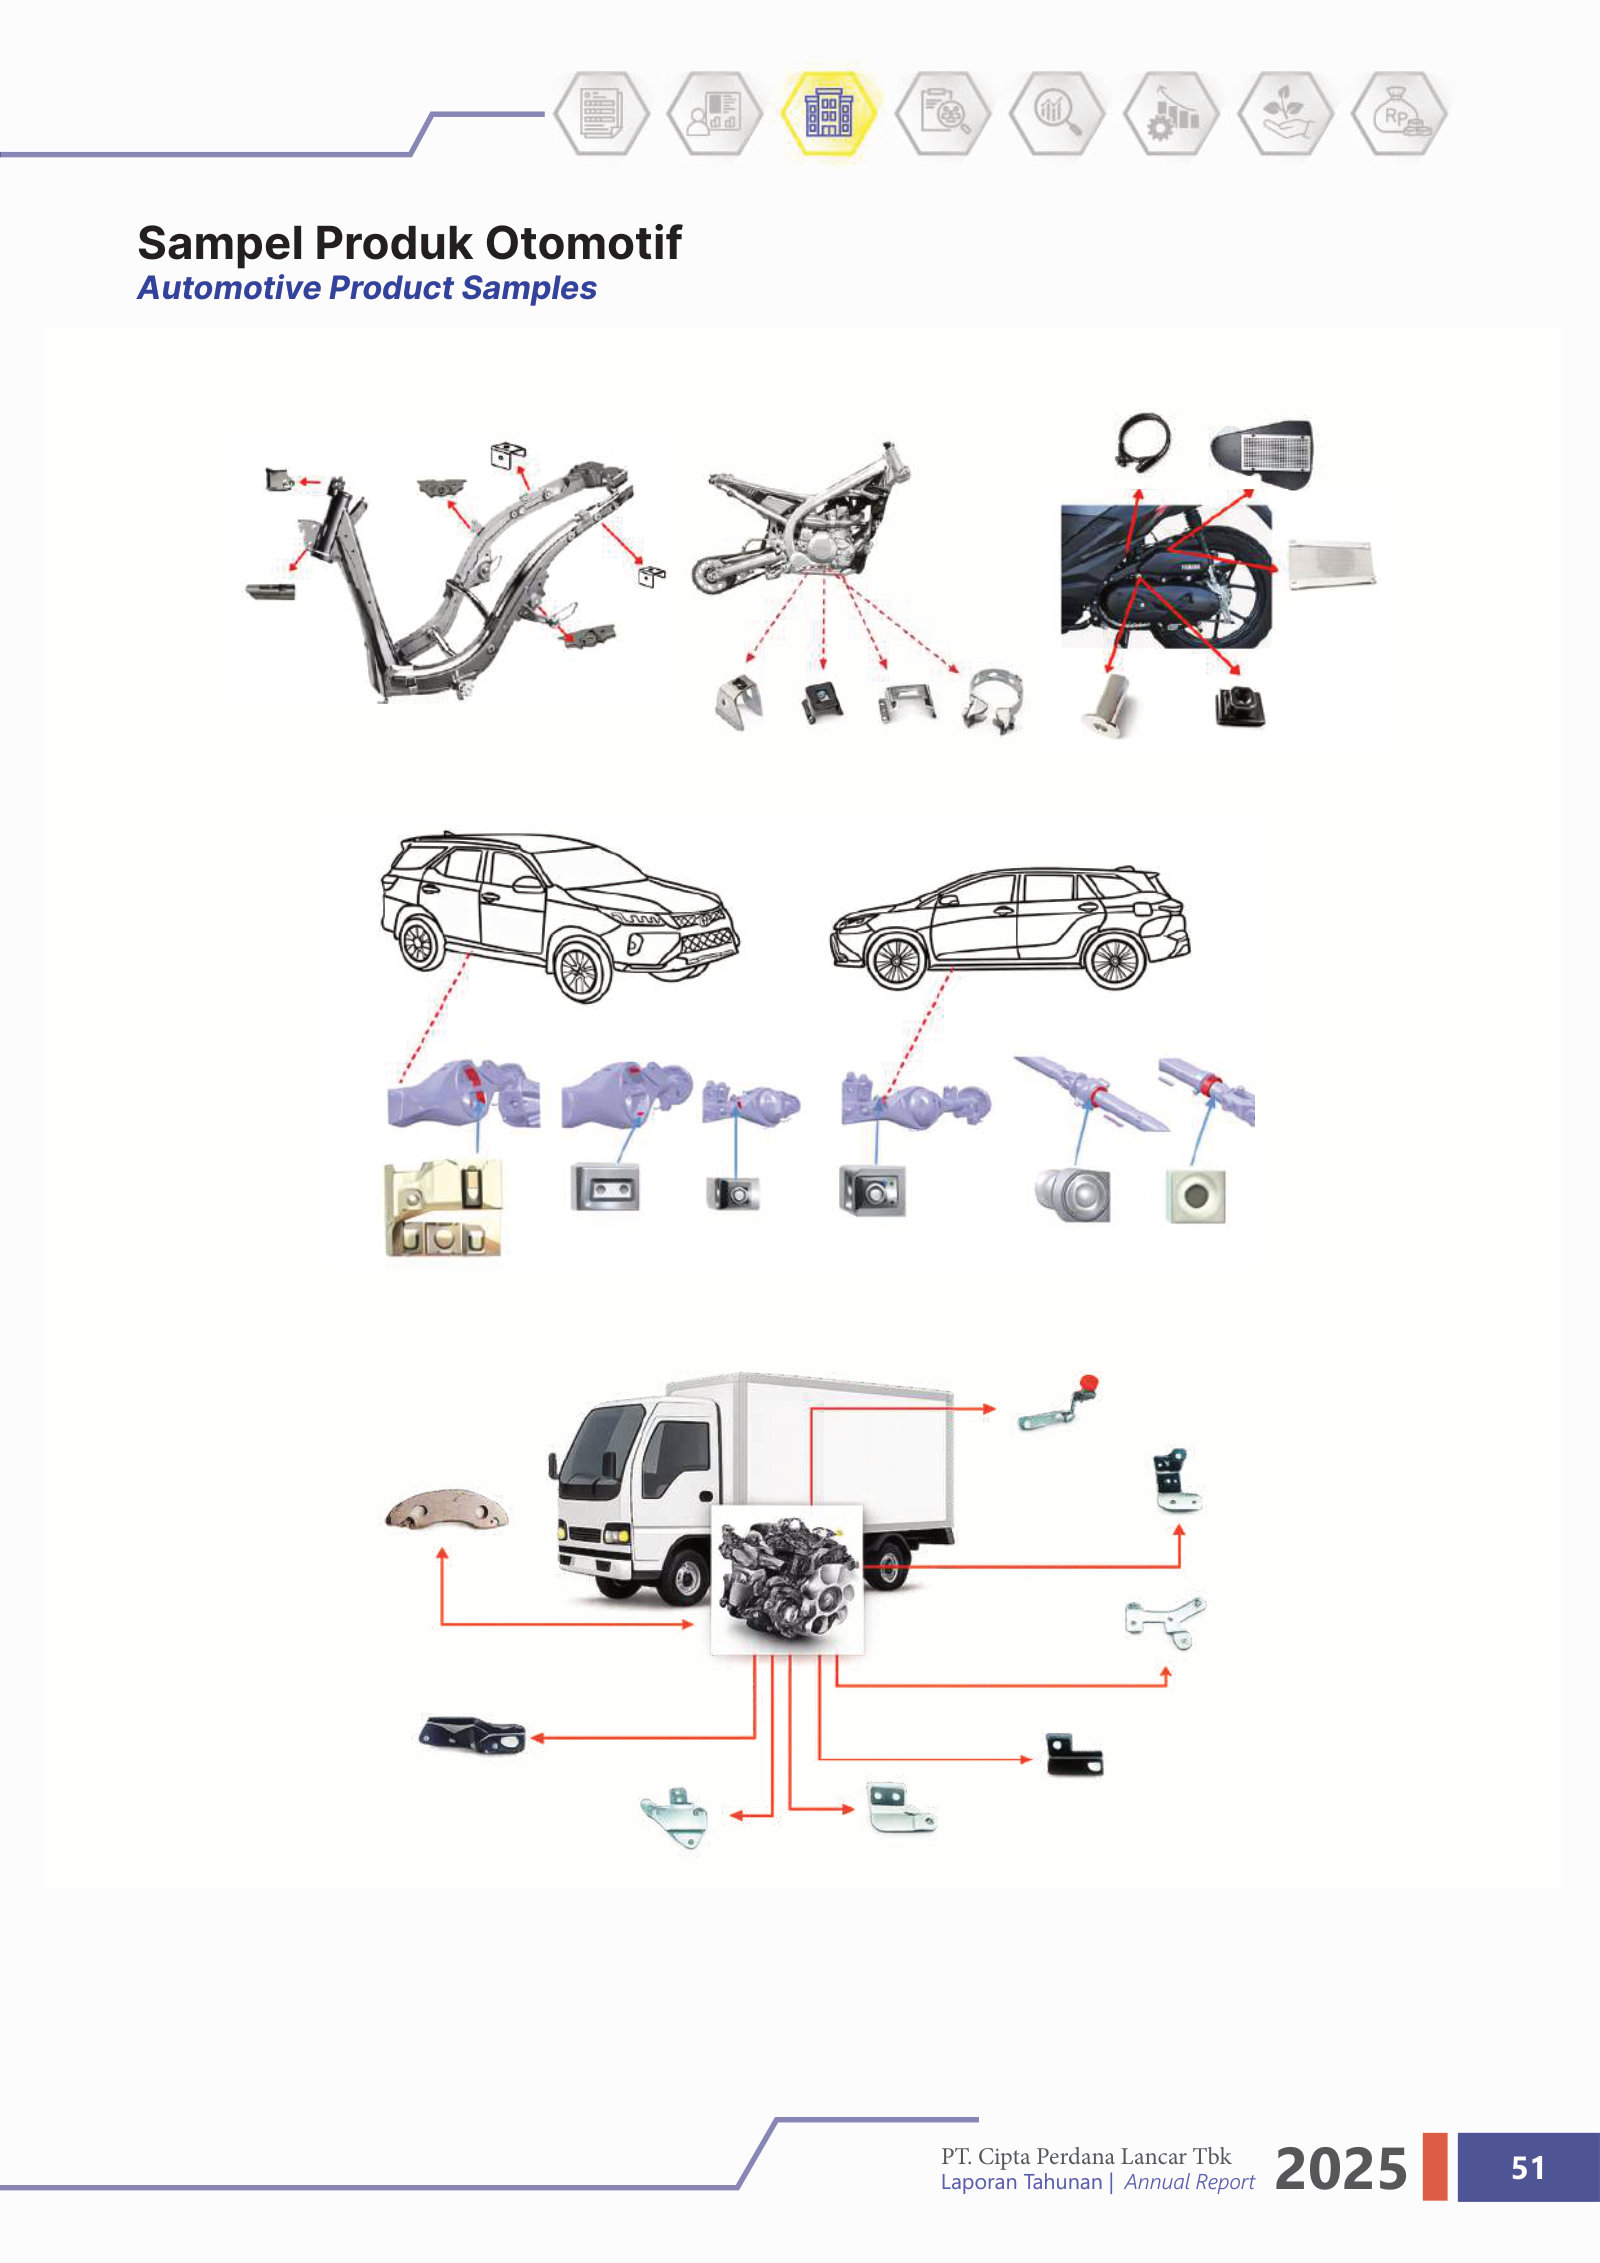
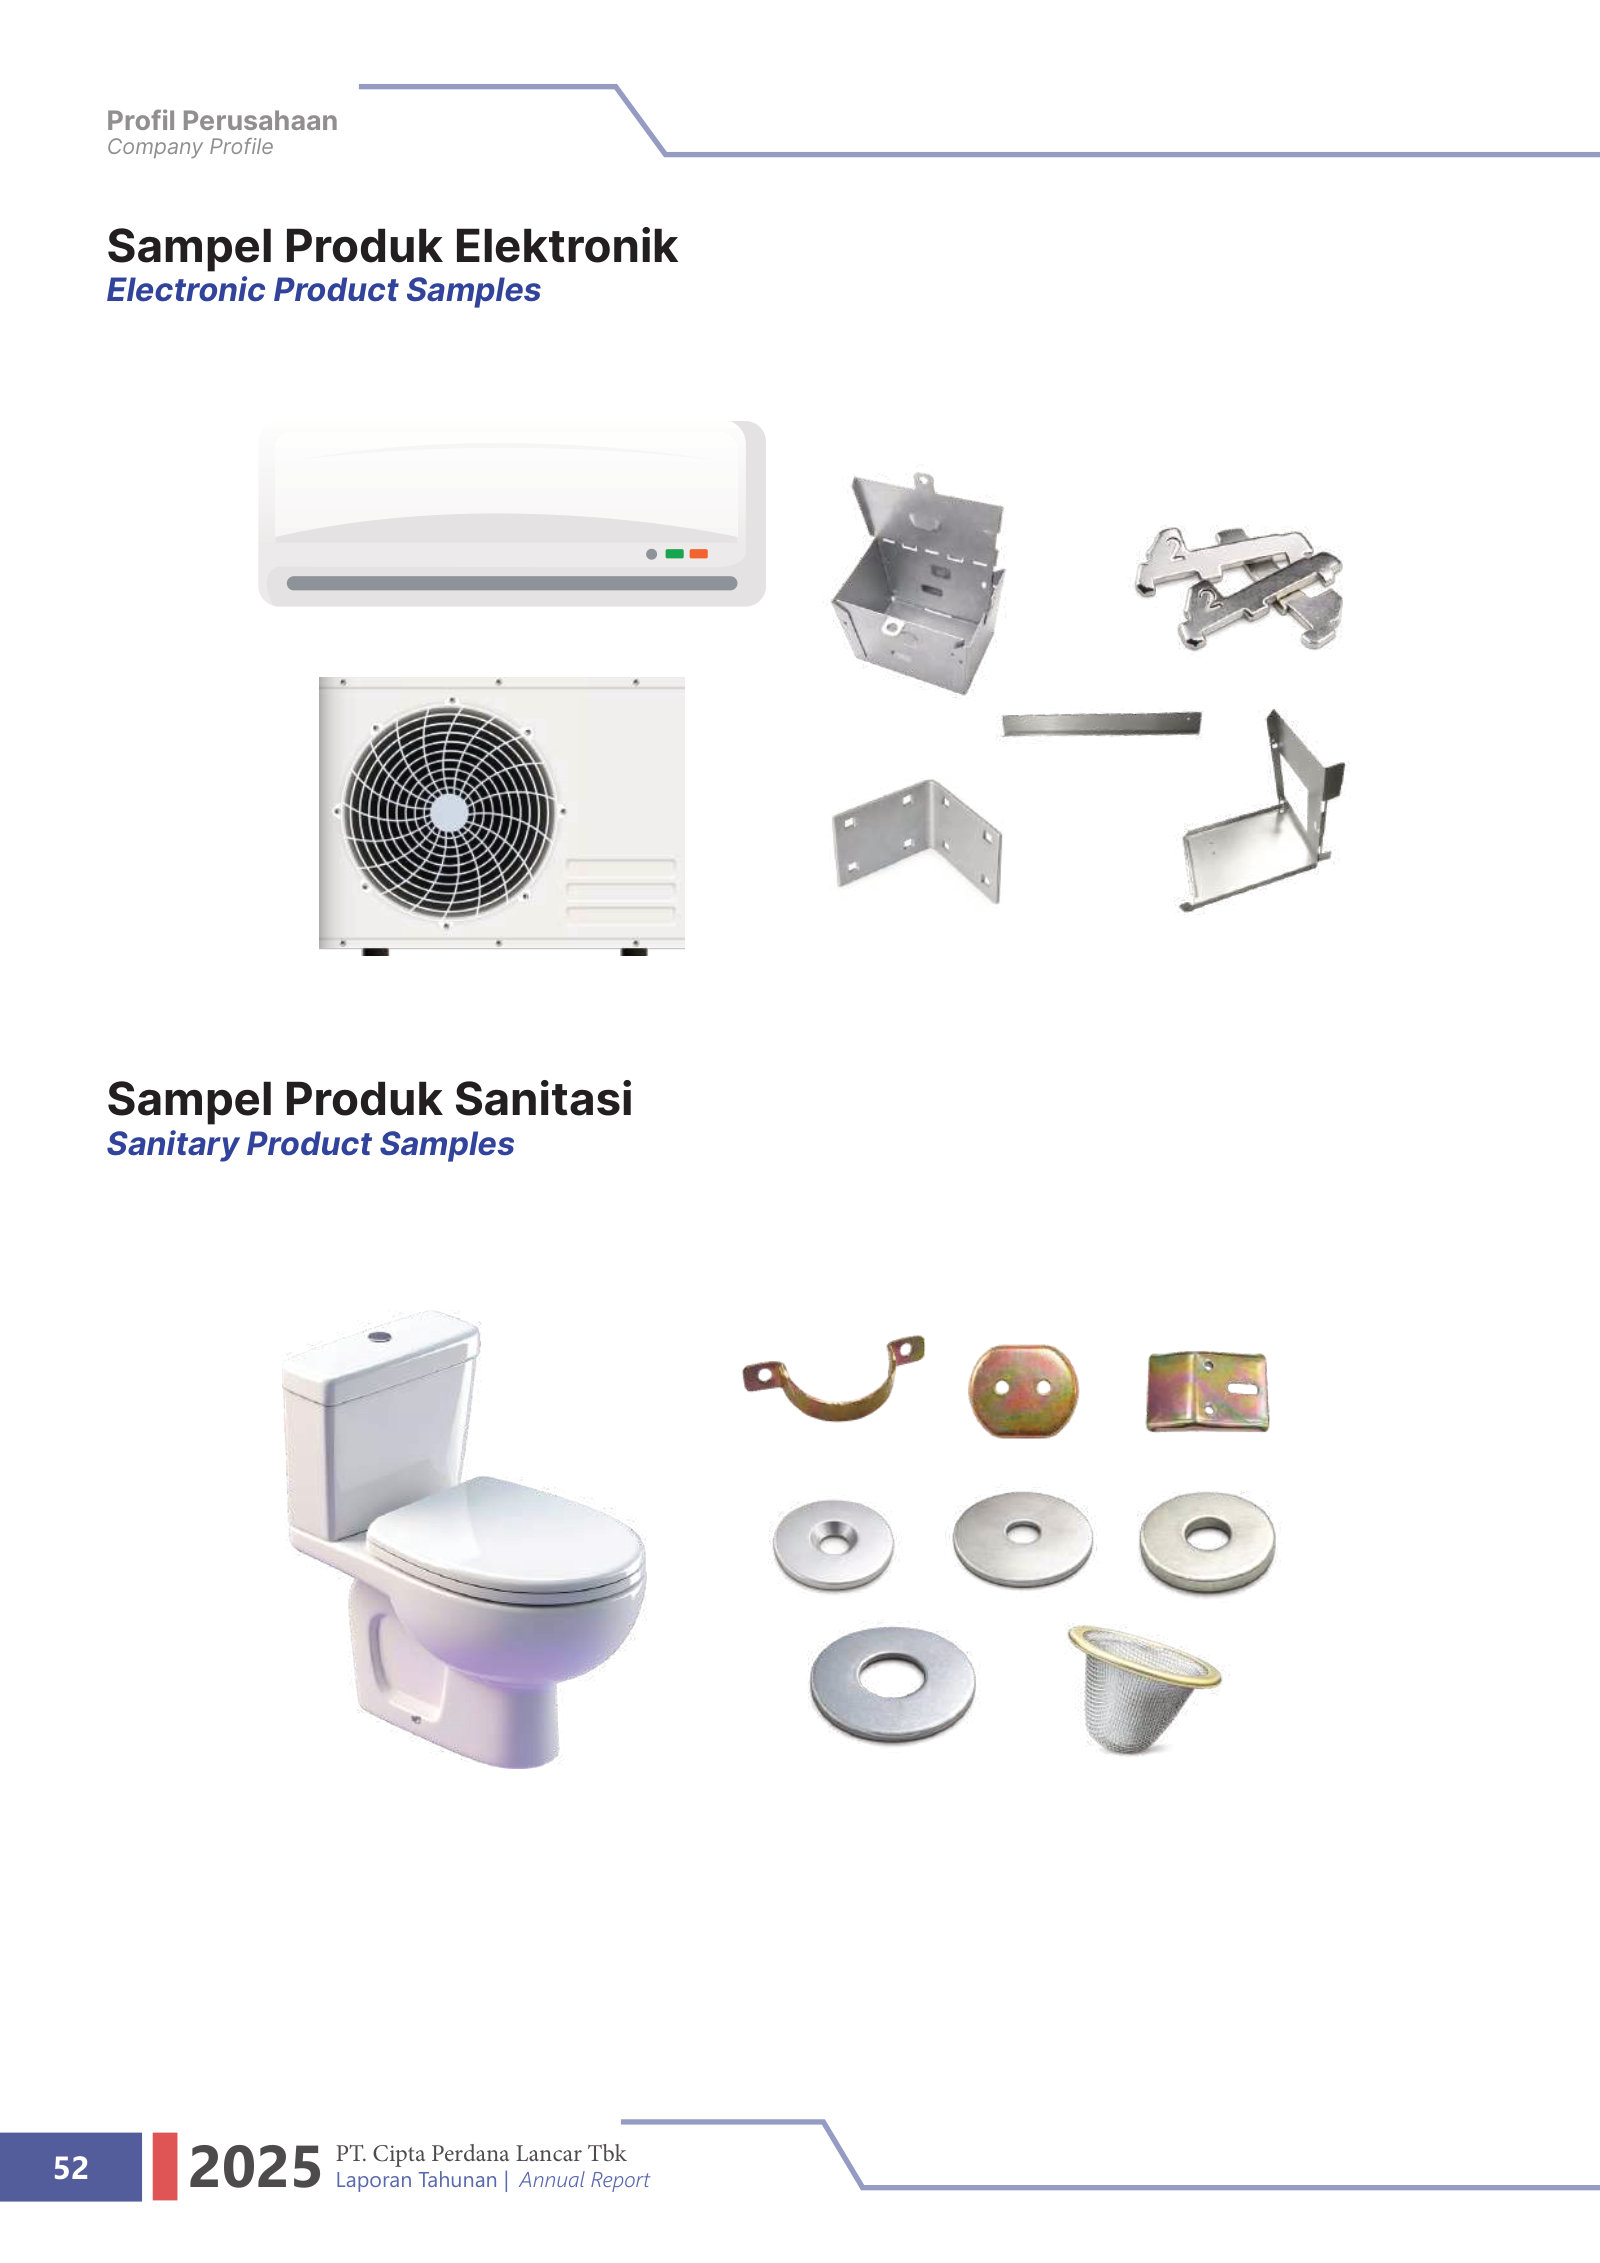
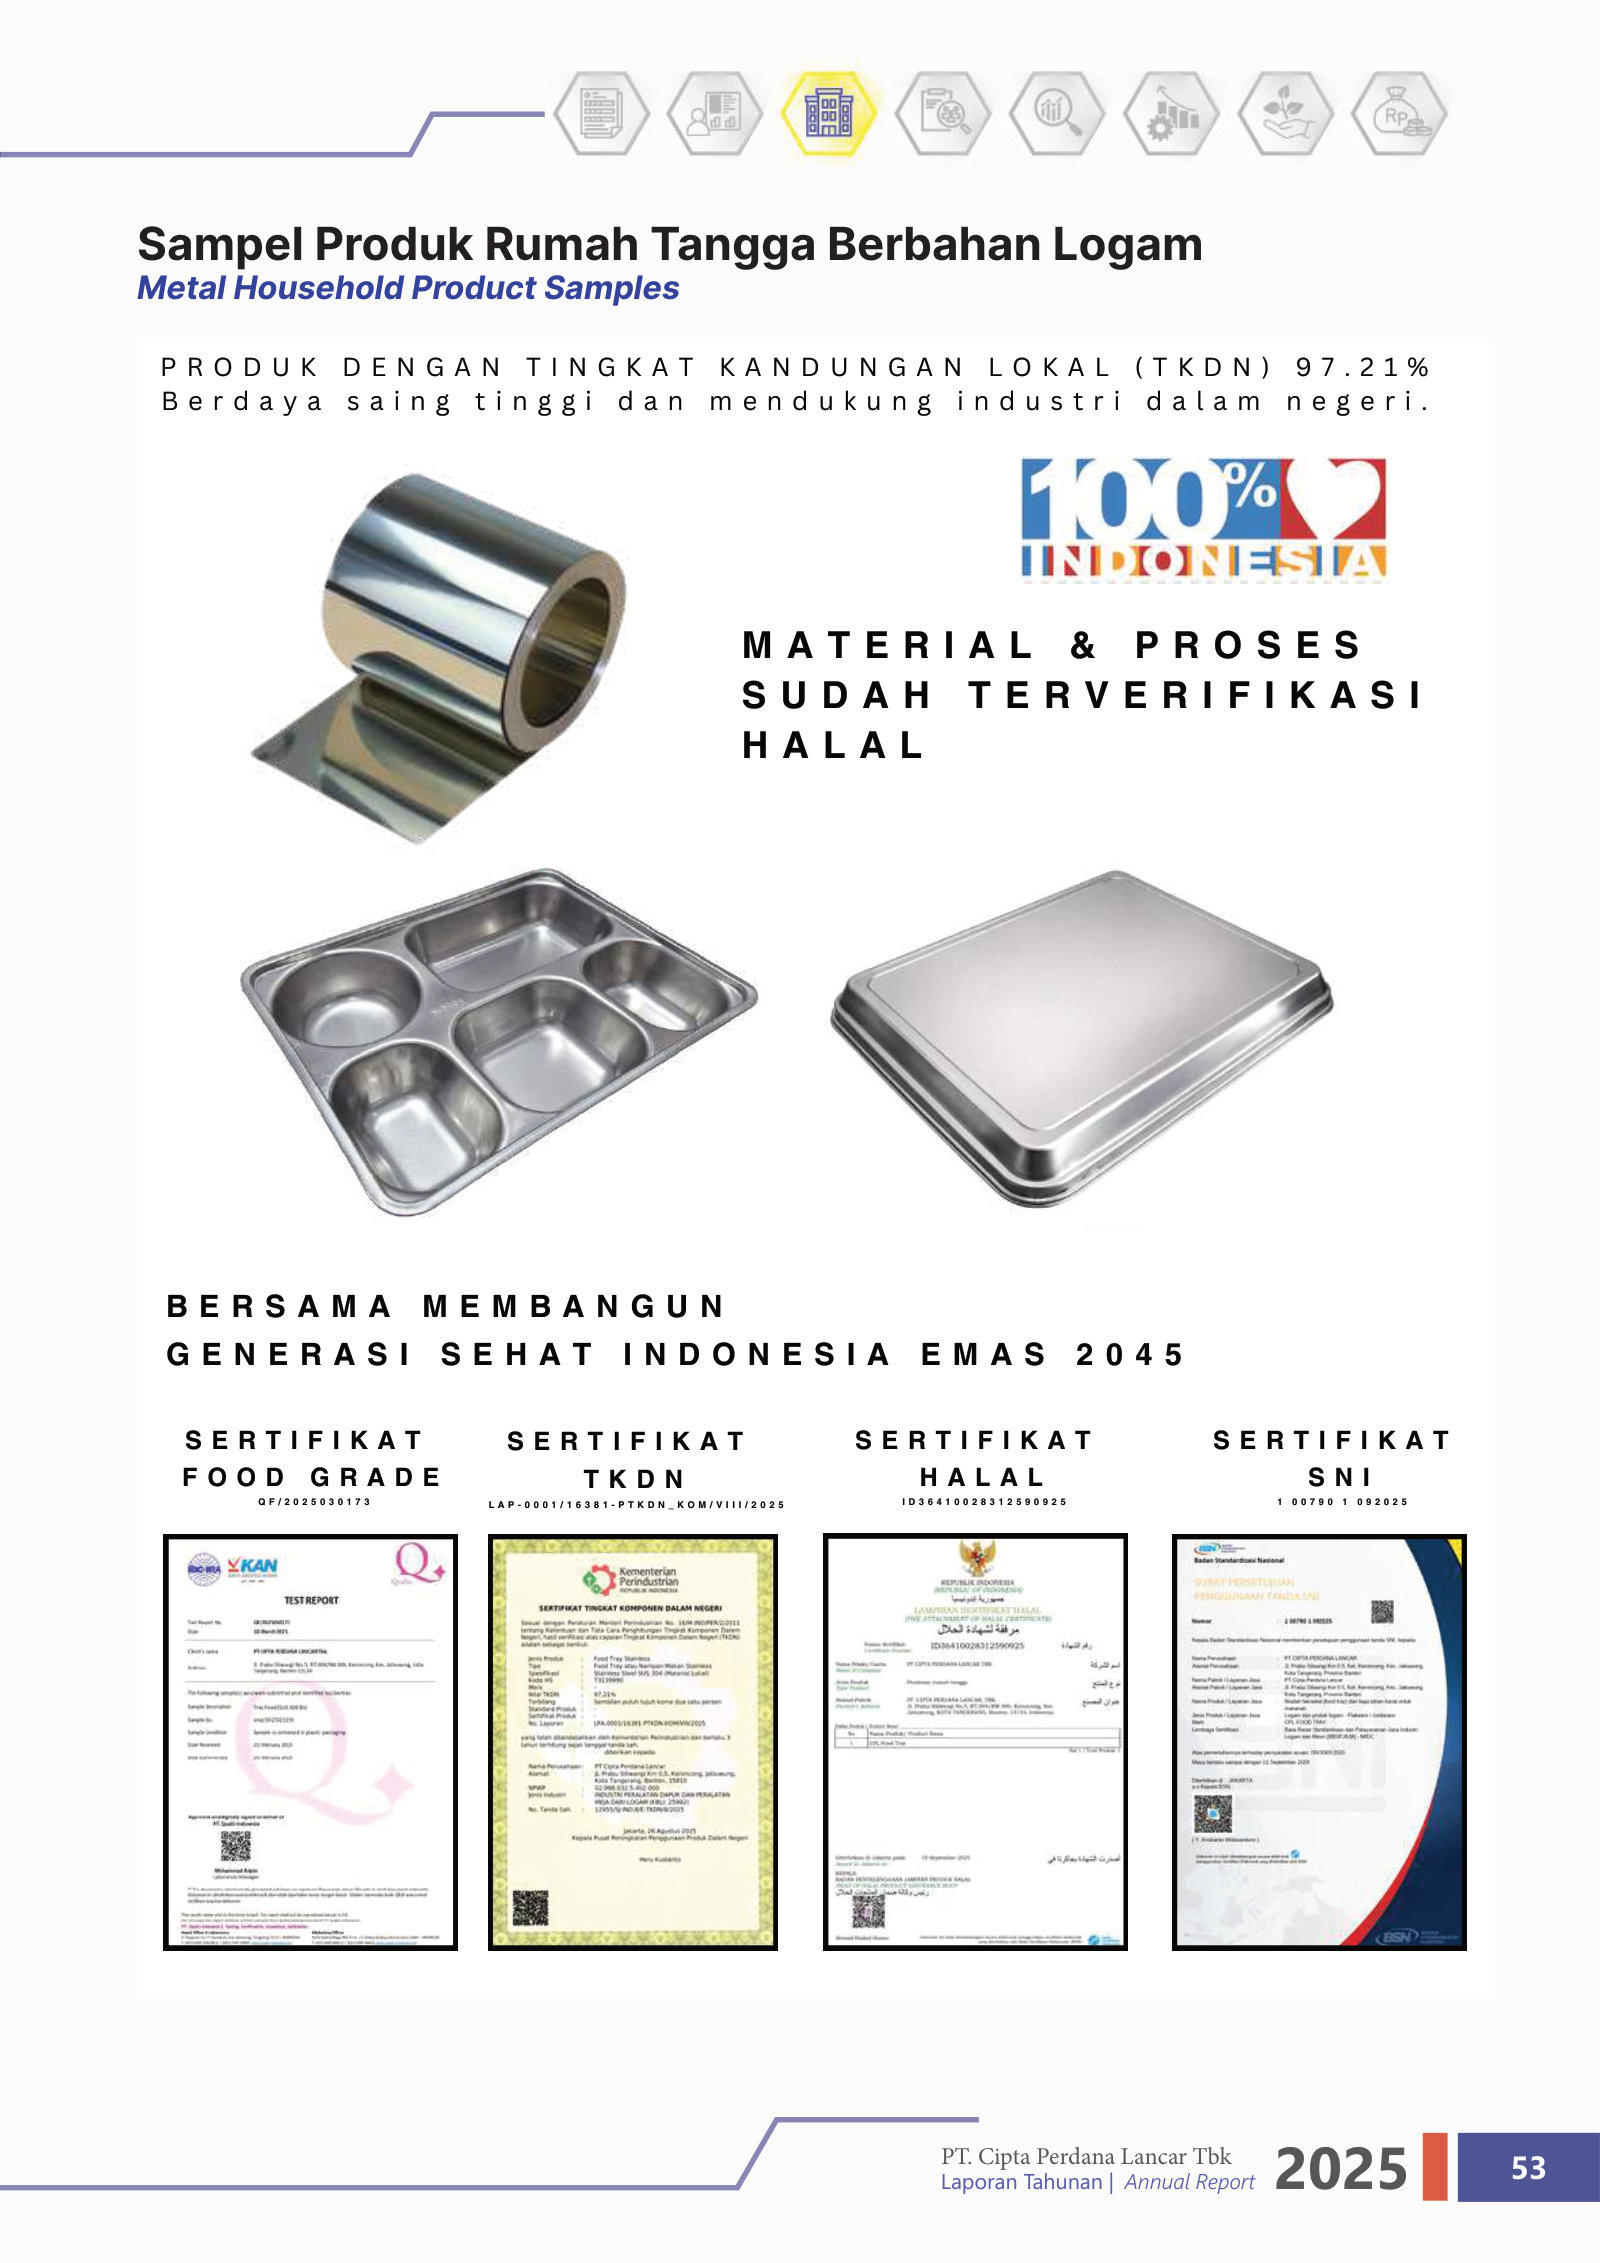
The only investor-facing document with visual explainers of the business; its company-profile section reads like an overview deck — what PART makes, its segments, history, strategy and financials. · Open the full document →
More from management
Public Expose Tahunan — Q&A Summary — 2025 · 3 pages · Management's June 2025 public-expose Q&A: IPO proceeds fully spent by Mar 2025 and the plan behind the Rp1 trillion revenue target. · Open →
PT Cipta Perdana Lancar Tbk's annual reports contain management's most considered account of the business. These are the sections, passages and visual pages worth opening in the originals preserved in Sources.
PT Cipta Perdana Lancar Tbk — FY2025 Annual Report (Laporan Tahunan) — FY2025
First full year as a listed company: the auto-parts stamper adds a metal-household segment that turns 3 product lines into 4 and lifts revenue 38%. · Open the full document →
Company Profile — About PT Cipta Perdana Lancar Tbk — p. 39 · Read the full section →
The plainest statement of the business: an auto-component stamper, listed since July 2024, now moving into electronics and metal goods.
From an automotive-component maker to a diversified metal manufacturer.
Since its inception, the Company has operated as a manufacturer of automotive components, focusing on delivering high-quality products for the national automotive industry. In carrying out its operations, the Company positions itself as a strategic partner to various automotive companies in Indonesia, emphasizing product reliability, timely delivery, and services that support the continuity of the industry’s supply chain. […] In line with its business development, the Company has continuously expanded its business scope by entering the electronics and sanitation sectors as part of its strategy to strengthen its business portfolio and enhance resilience against market dynamics.
p. 39 · Read in context →
Company Profile — The Company's Business Activities and Products — p. 50 · Read the full section →
How it actually makes money: B2B metal stamping, welding, coating and assembly for OEM, Tier-1/Tier-2 and aftermarket customers.
A B2B metal-fabrication model built on stamping, welding, coating and assembly.
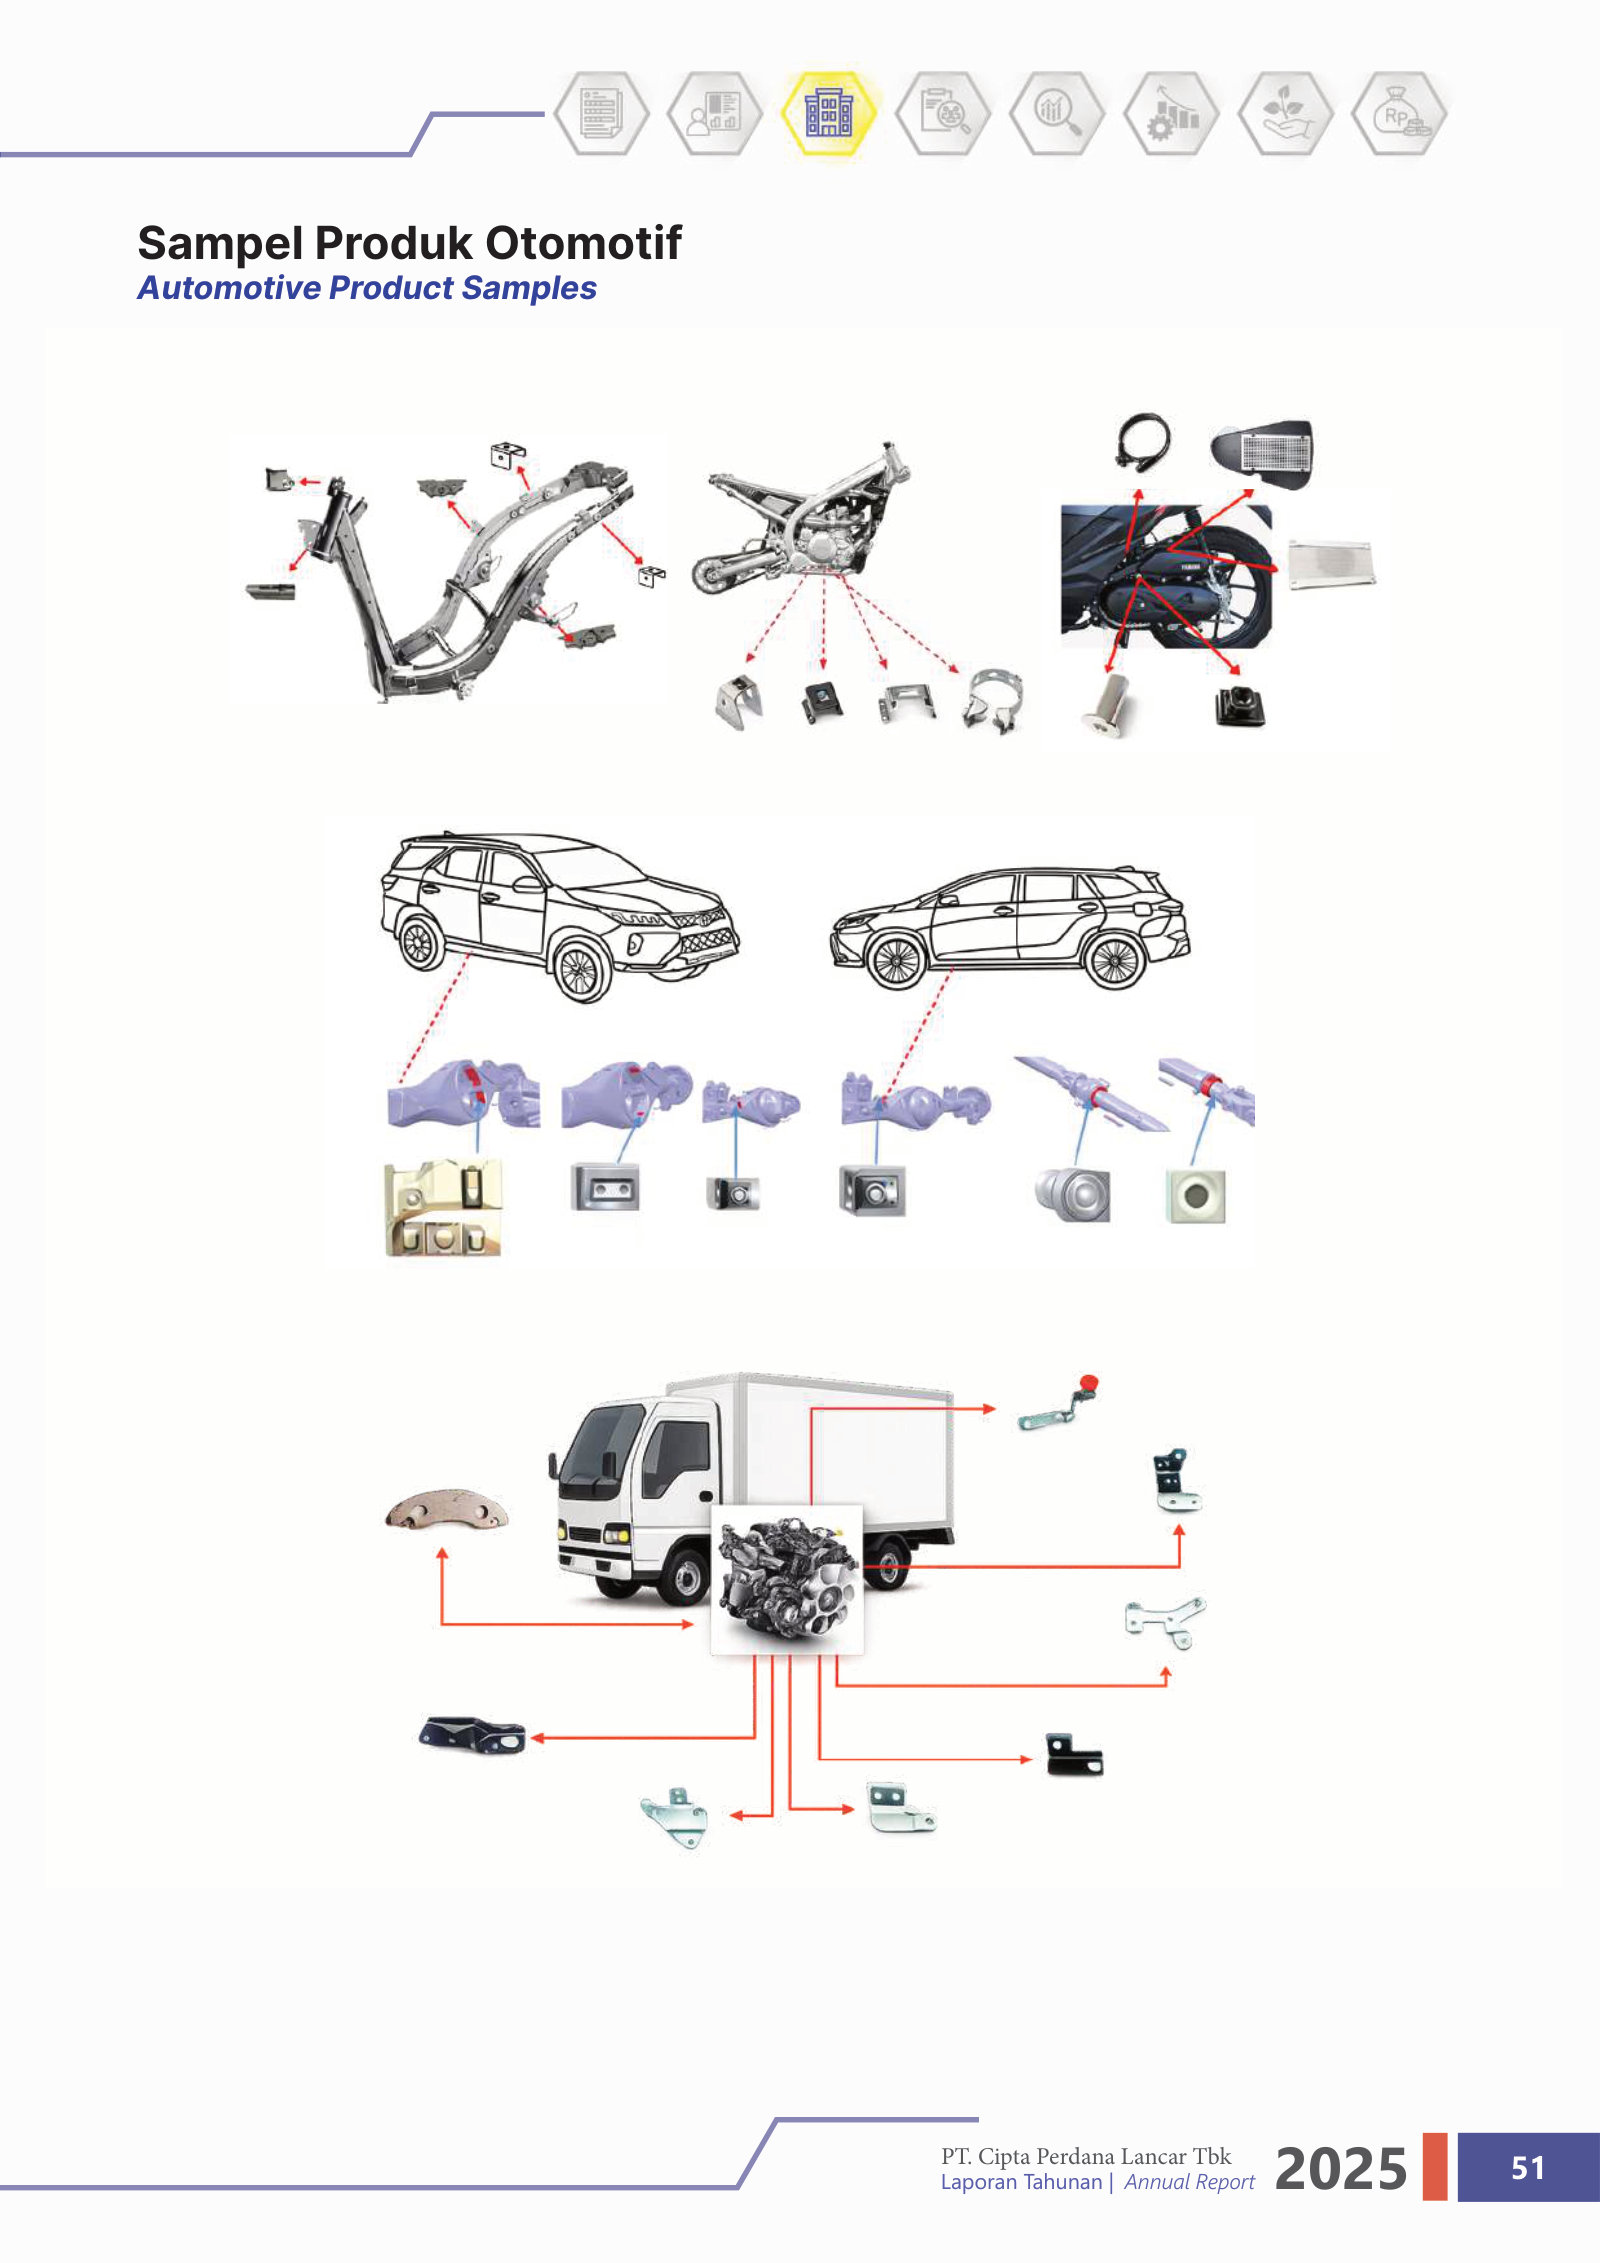
The Company manufactures metal-based components and sub-assemblies for the automotive, electronics, sanitation, and metal household equipment sectors. Products are produced through standardized and documented manufacturing processes, including stamping, welding, coating, and assembly, ensuring consistent product quality, dimensional accuracy, and corrosion protection through to delivery to customers. […] As a B2B business partner, the Company provides after-sales services that emphasize responsiveness and the continuity of customers’ operations.
p. 50 · Read in context →
Management Discussion and Analysis — Business Overview & Operational Review by Business Segment — p. 92 · Read the full section →
Management's own segment map, with the table showing automotive as the backbone and a new metal-household line arriving at Rp62bn.
Automotive remains the backbone; household products are the new diversification bet.
The Company’s business activities focus on manufacturing components and spare parts for twowheel and four-wheel motor vehicles, which remain the backbone of its revenue to date. […] In an effort to strengthen business resilience and expand its revenue base, the Company has developed non-automotive business diversification through the production of metal-based household products, such as food trays and gas and electric oil-water frying machines.
p. 92 · Read in context →
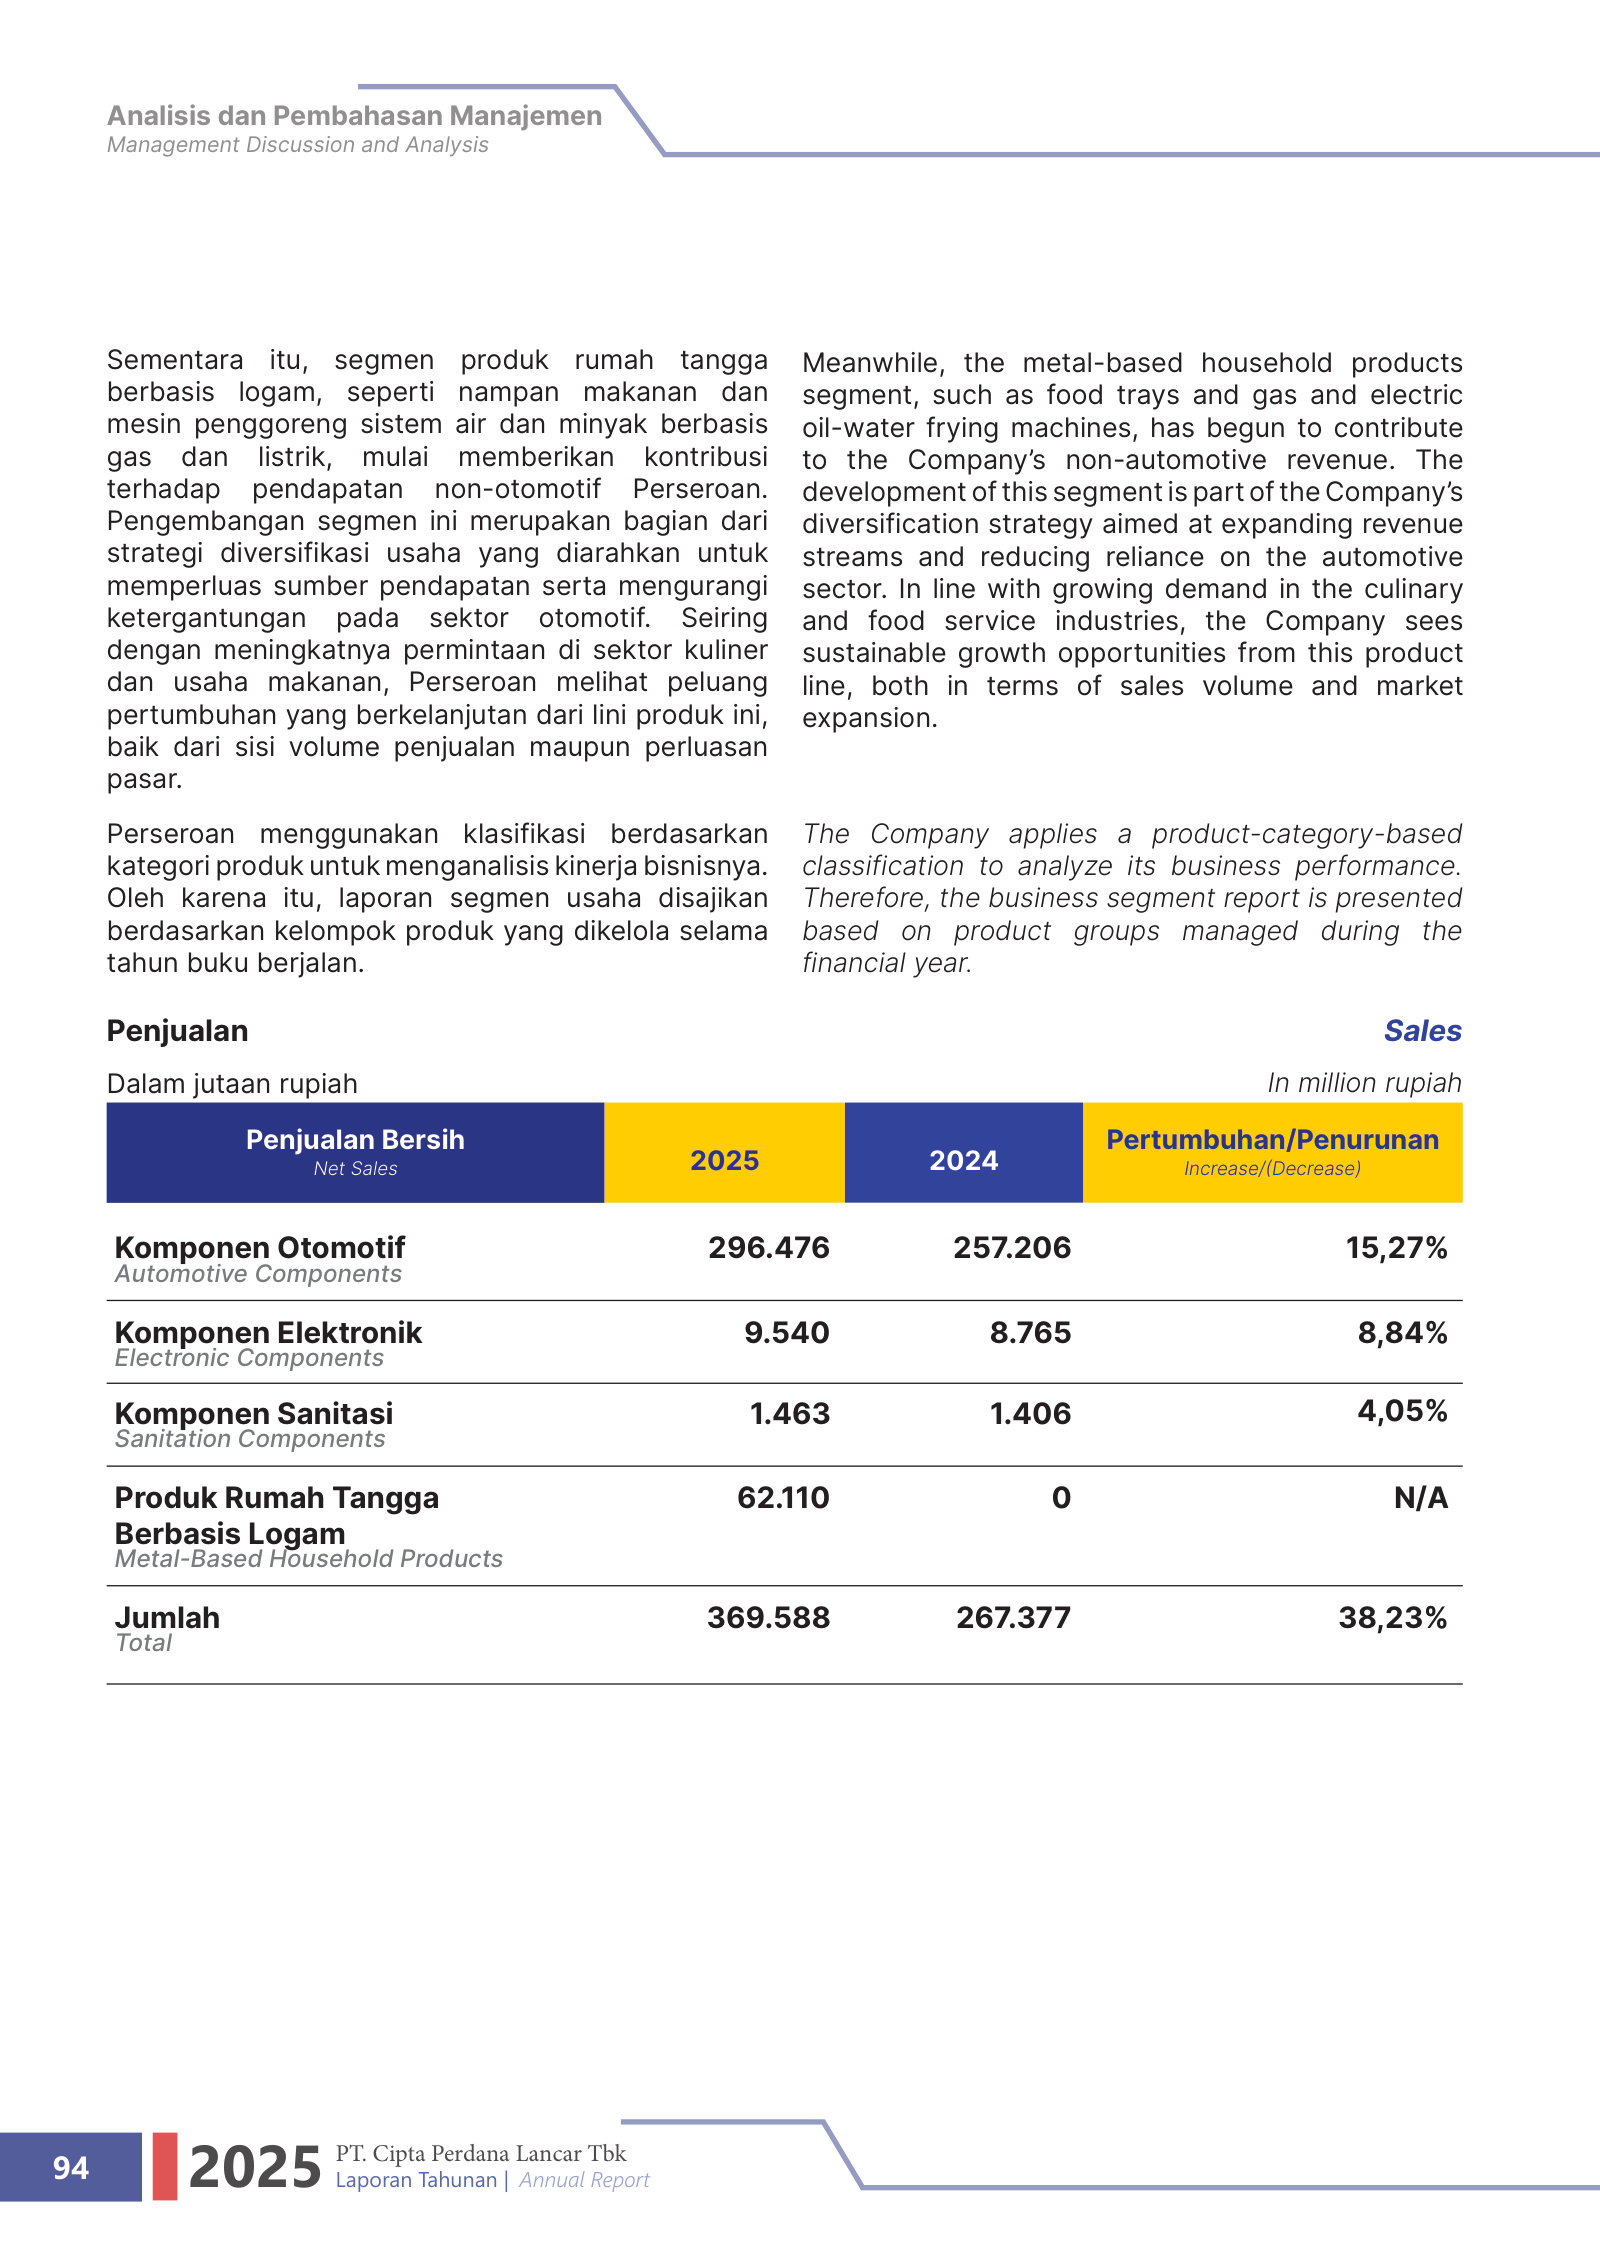
Management Discussion and Analysis — Financial Performance Review — p. 95 · Read the full section →
Where management explains results: sales +38% but COGS +43% on metal prices, and cash drawn from Rp55bn to Rp3bn as gearing rose.
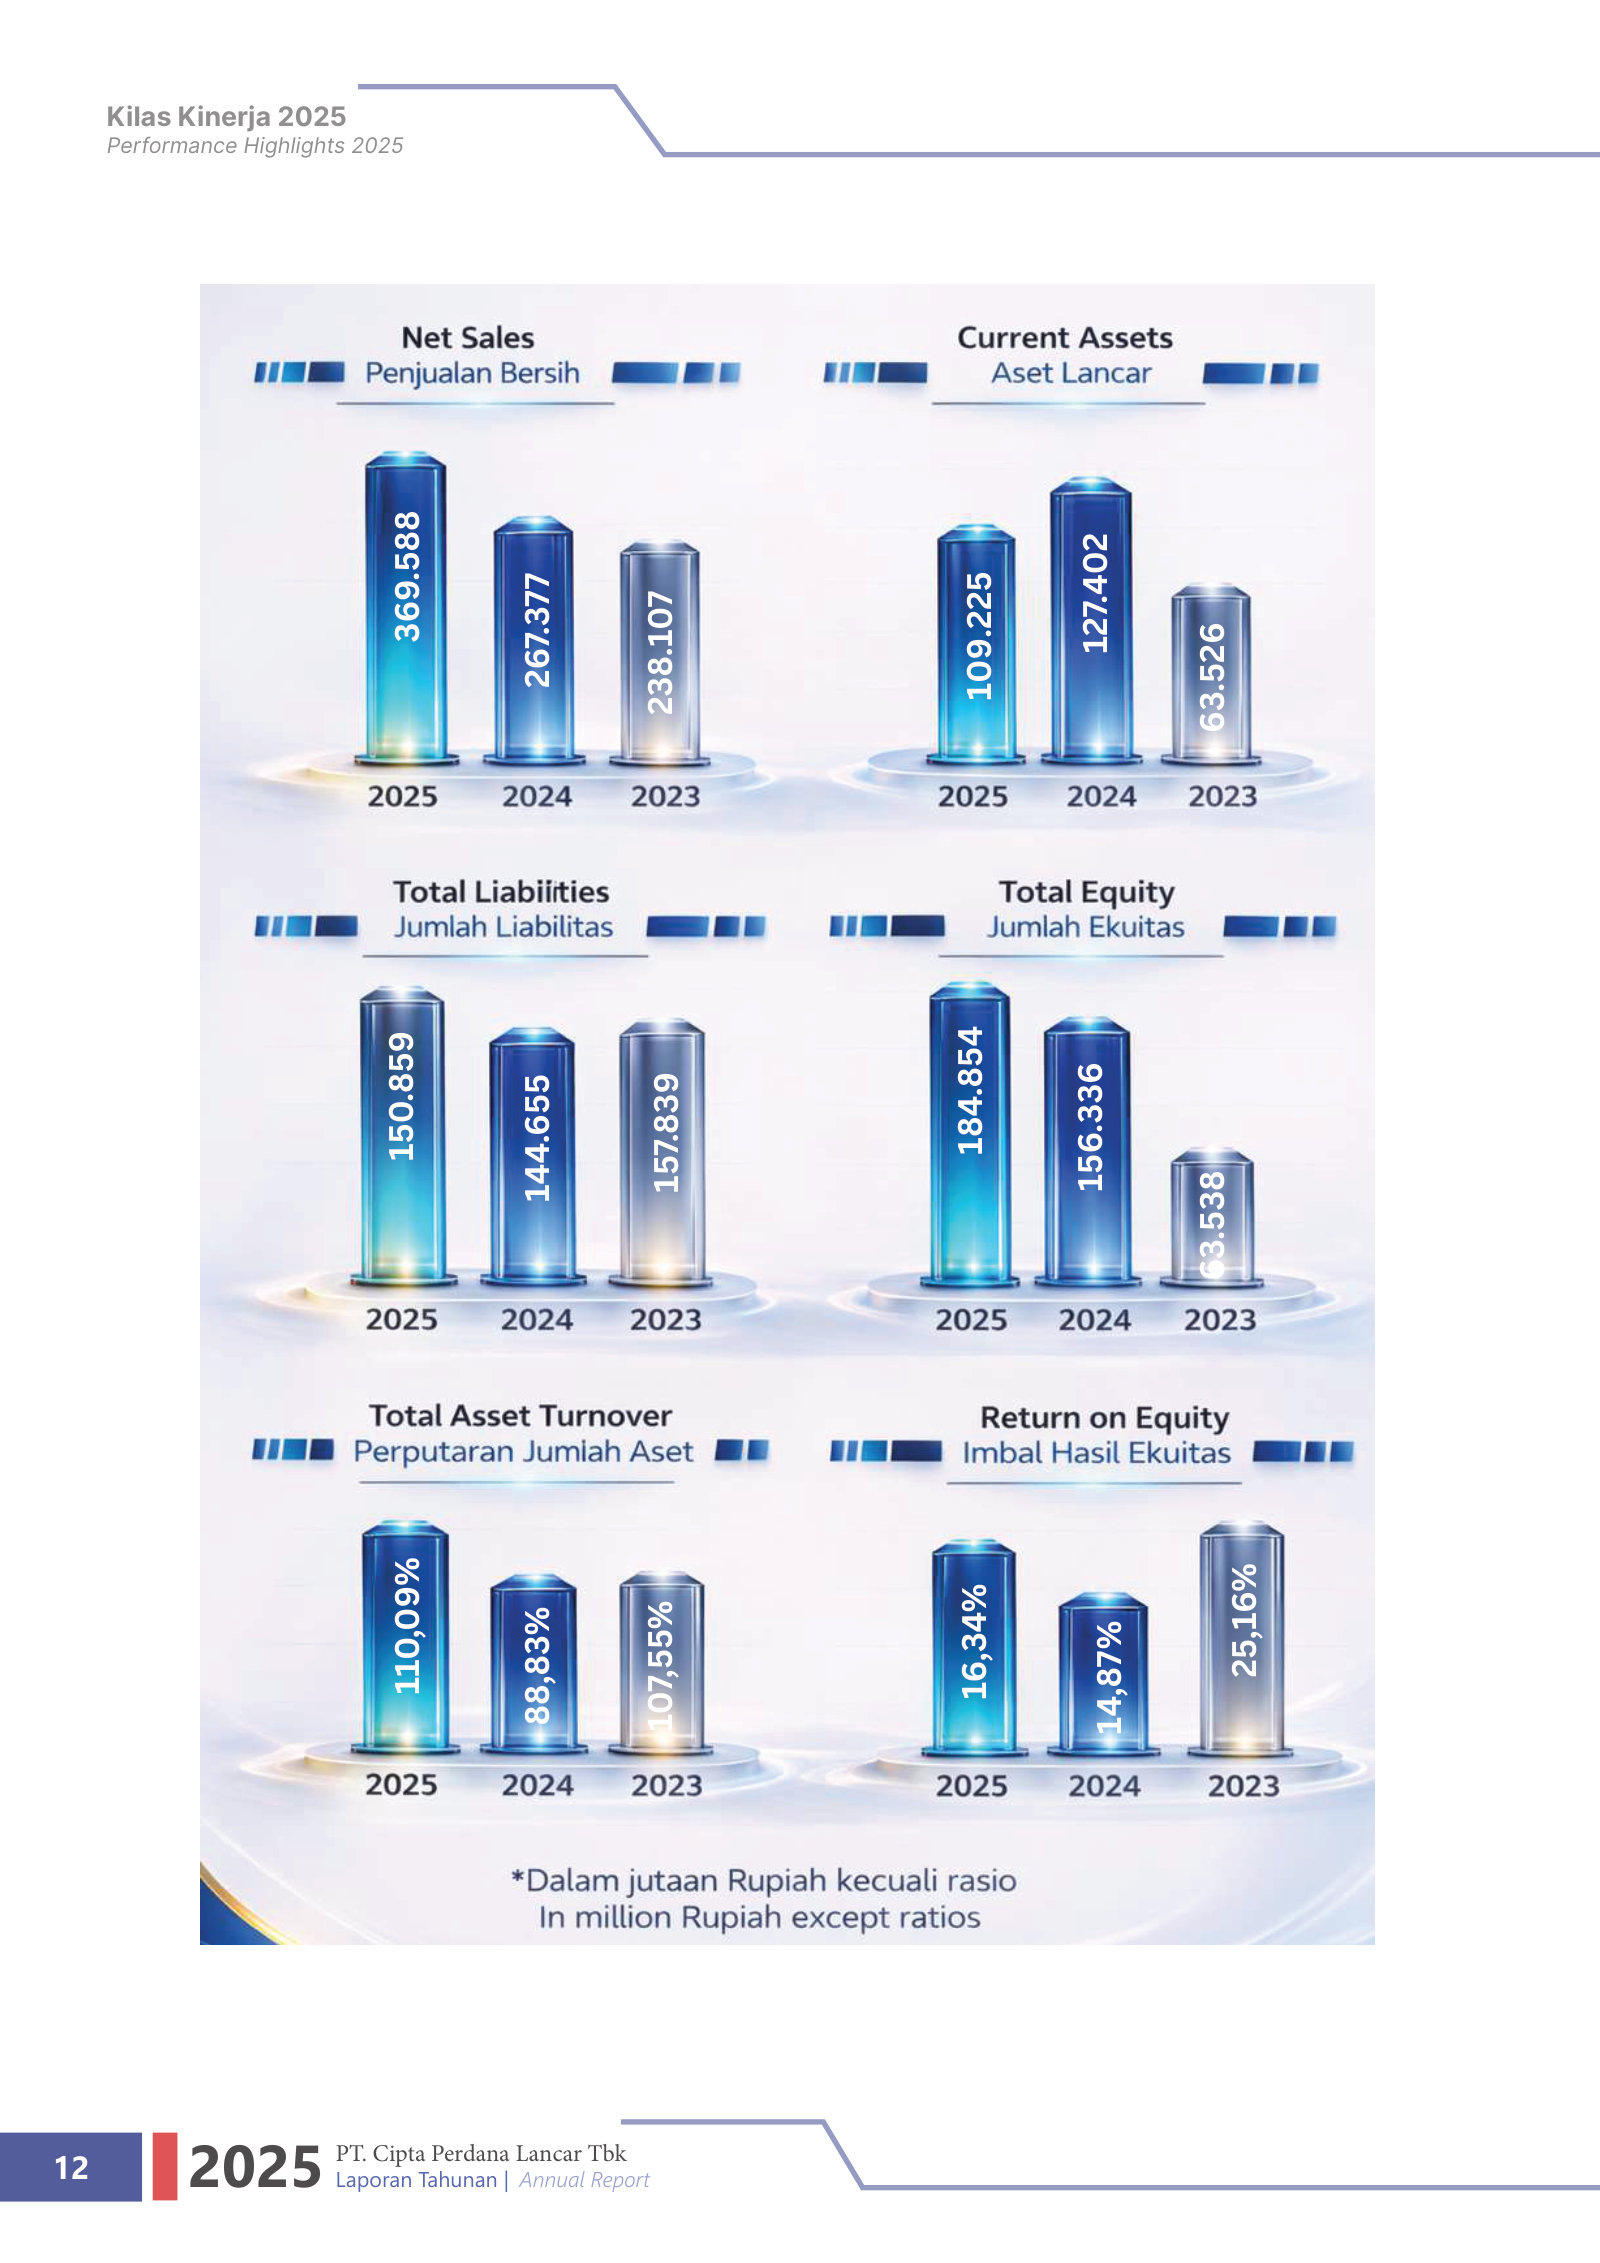
Revenue +38% to Rp369.6bn; cost of sales +43% on rising metal raw-material prices.
The Company’s net sales in 2025 reached IDR 369.6 billion, representing an increase of 38.23% compared to IDR 267.4 billion in 2024. This growth was primarily driven by higher production volumes in the automotive segment, as well as contributions from the metal-based household products segment, which has begun to positively impact the Company’s performance. […] Cost of goods sold increased by 43.08% to IDR 298.8 billion, in line with higher production capacity and rising metal raw material prices.
p. 98 · Read in context →
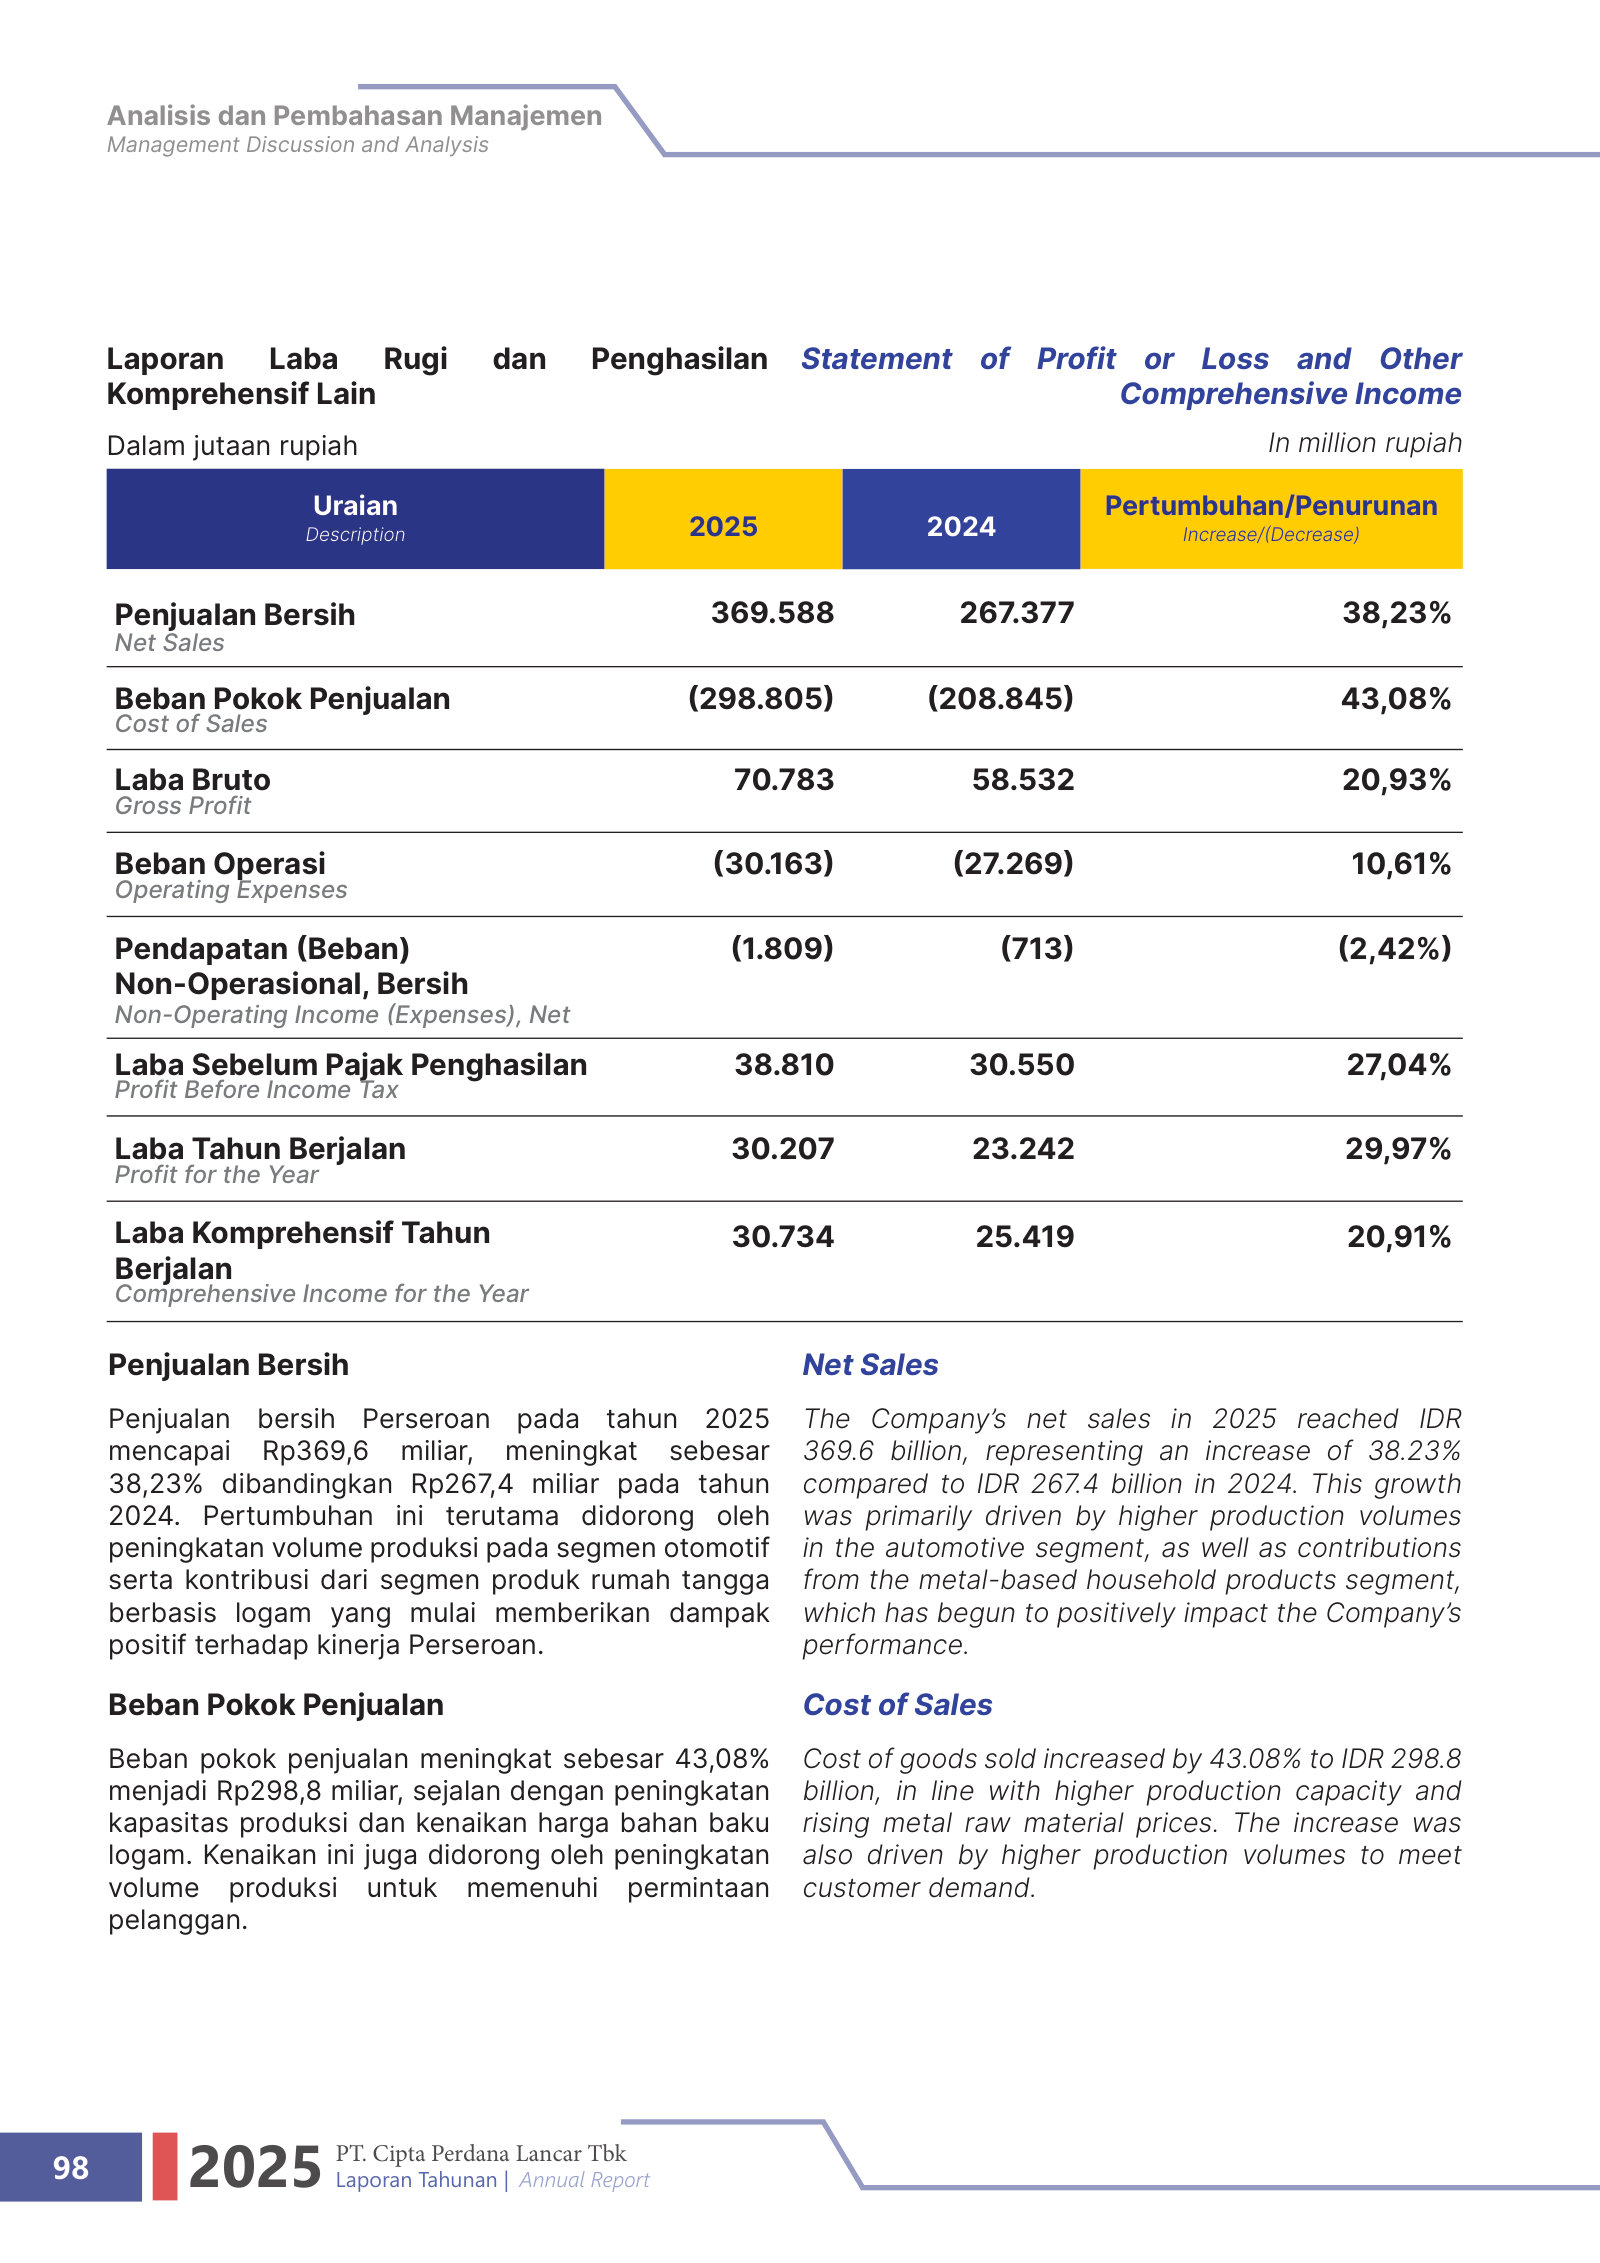
Management Discussion and Analysis — Business Prospect — p. 105 · Read the full section →
Management's forward view: automotive stays the primary earner while metal-household products are cast as the new growth engine.
Automotive to remain primary; household products framed as the new growth source.
The automotive segment is expected to remain the Company’s primary revenue contributor, driven by the growing demand for spare parts for both twoand four-wheeled vehicles. […] In 2025, the Company strengthened its business diversification into metal-based household products, particularly food trays and gas and electric oilwater frying machines. […] Supported by the government’s downstream industry policies, this segment is expected to become a sustainable new source of growth for the Company.
p. 105 · Read in context →
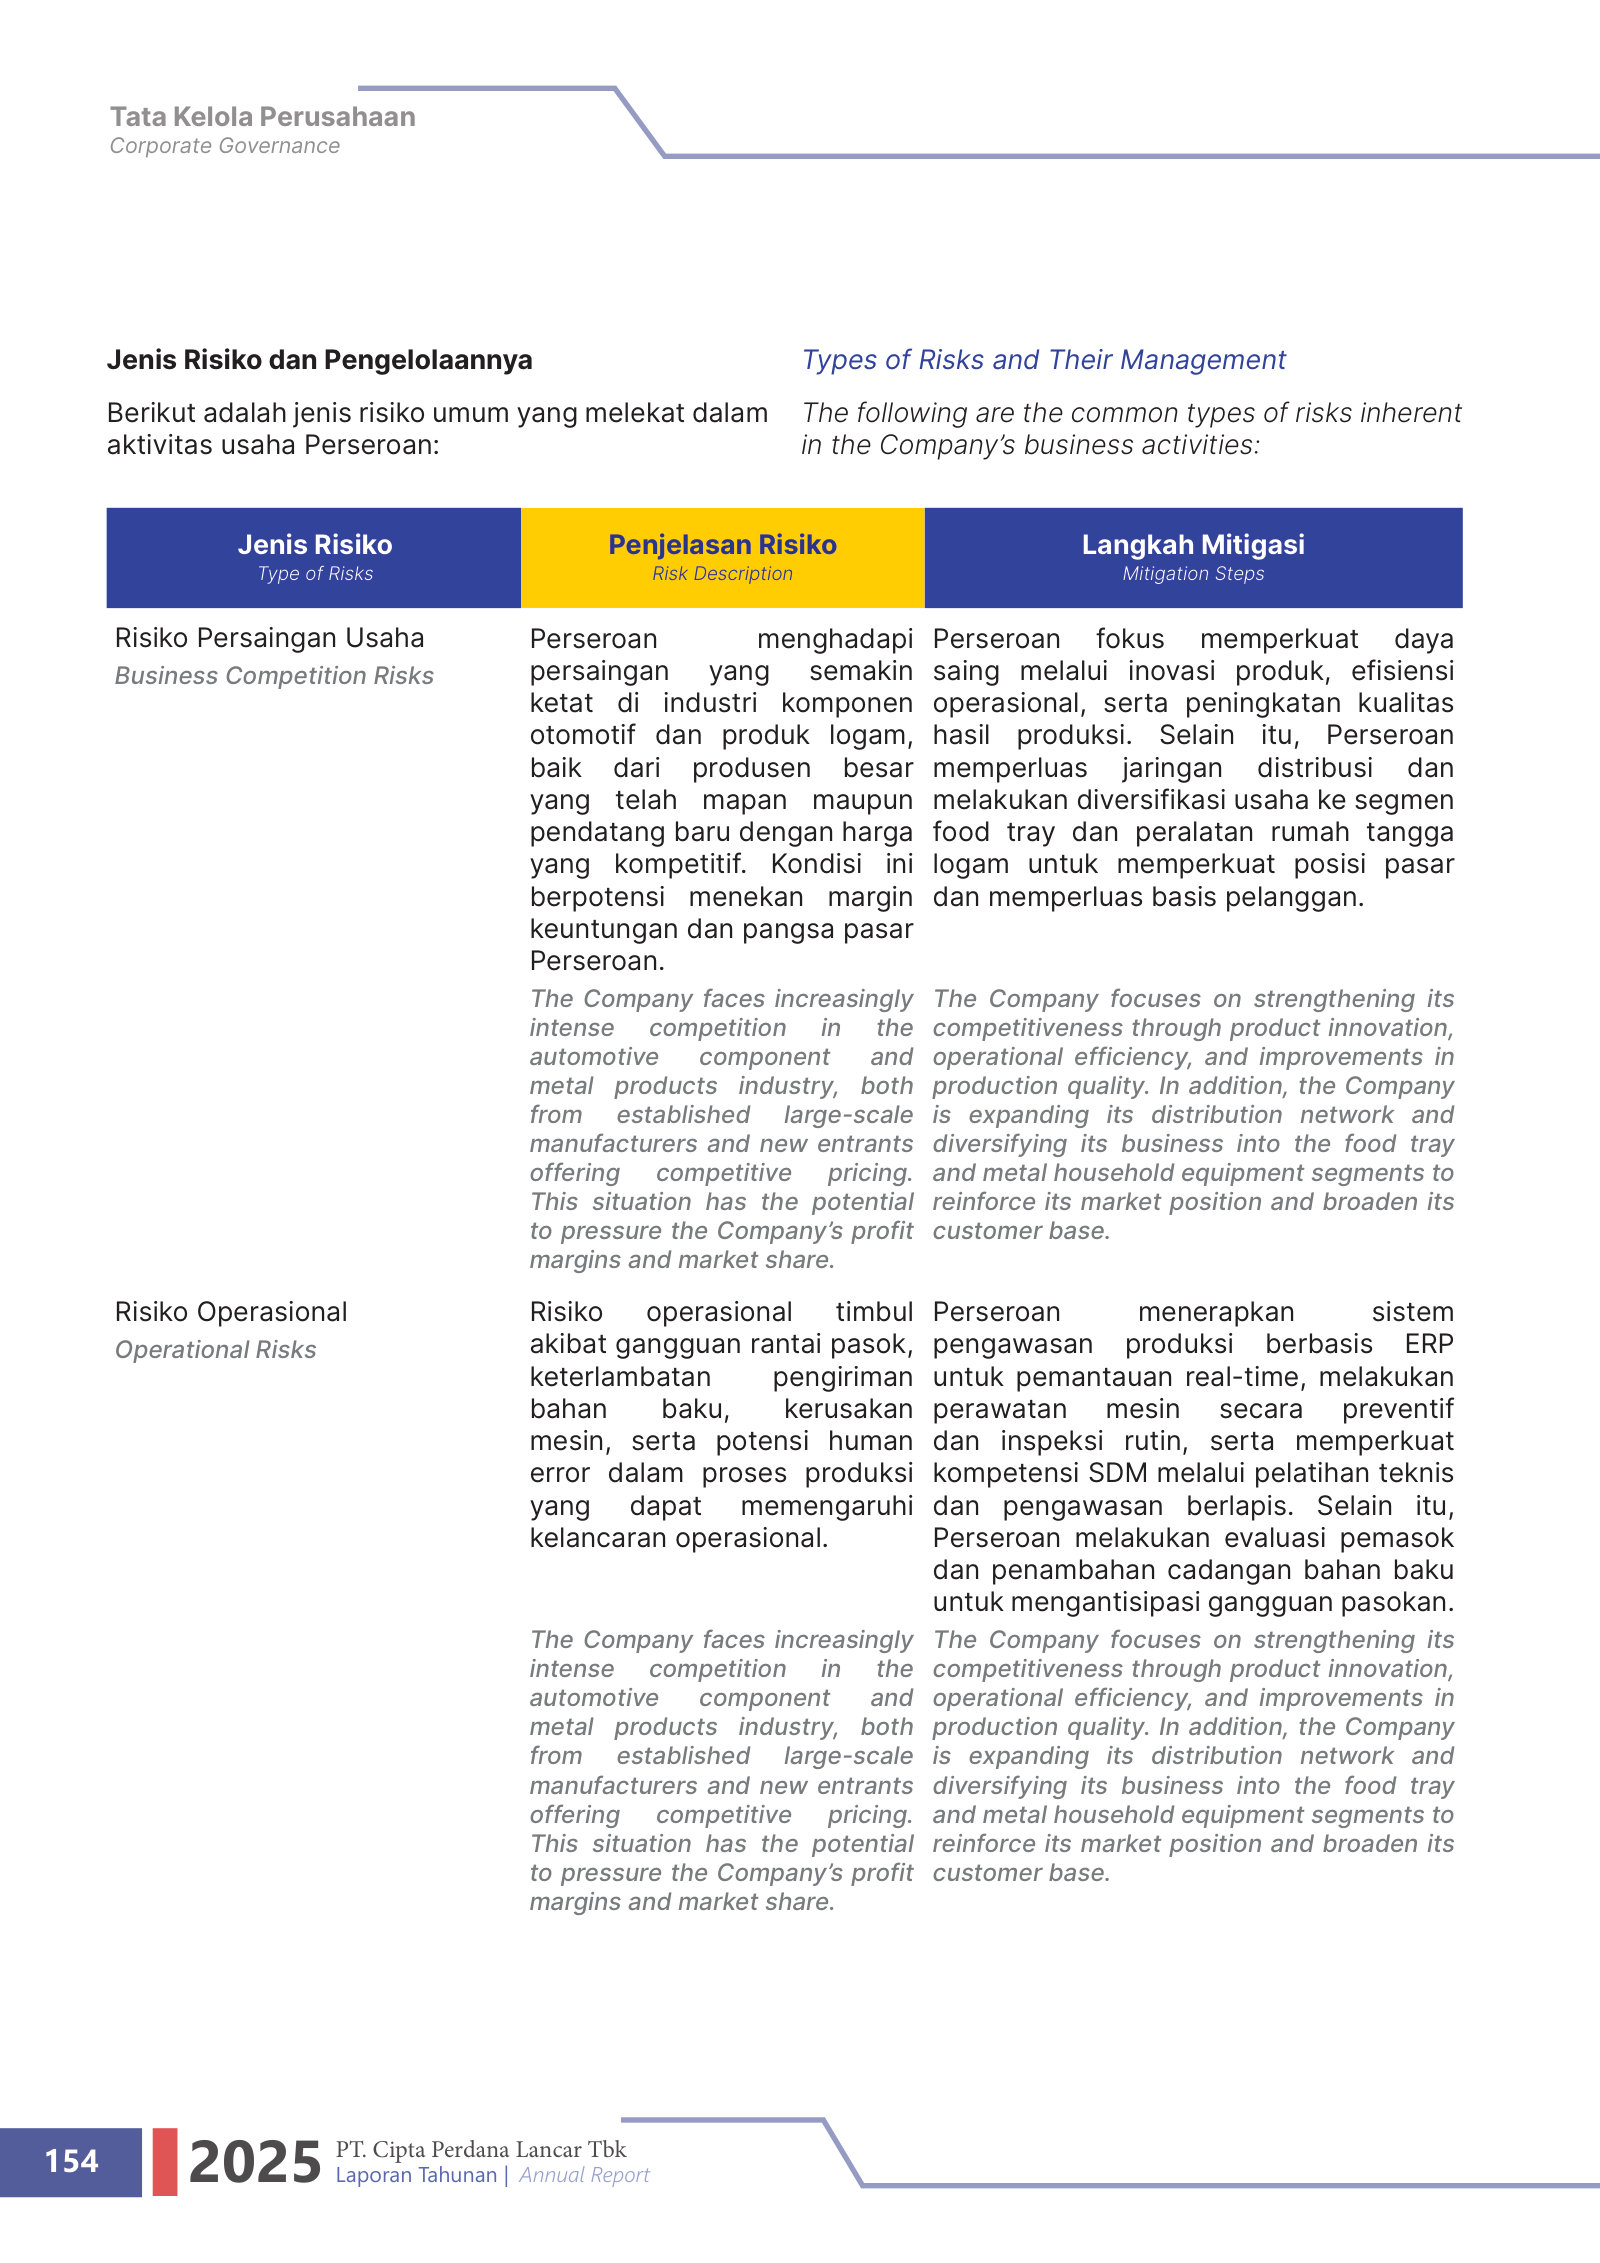
Good Corporate Governance — Types of Risks and Their Management — p. 154 · Read the full section →
The risks that could bite: price competition on margins, supply-chain and machinery disruption, and raw-material, energy and rate exposure.
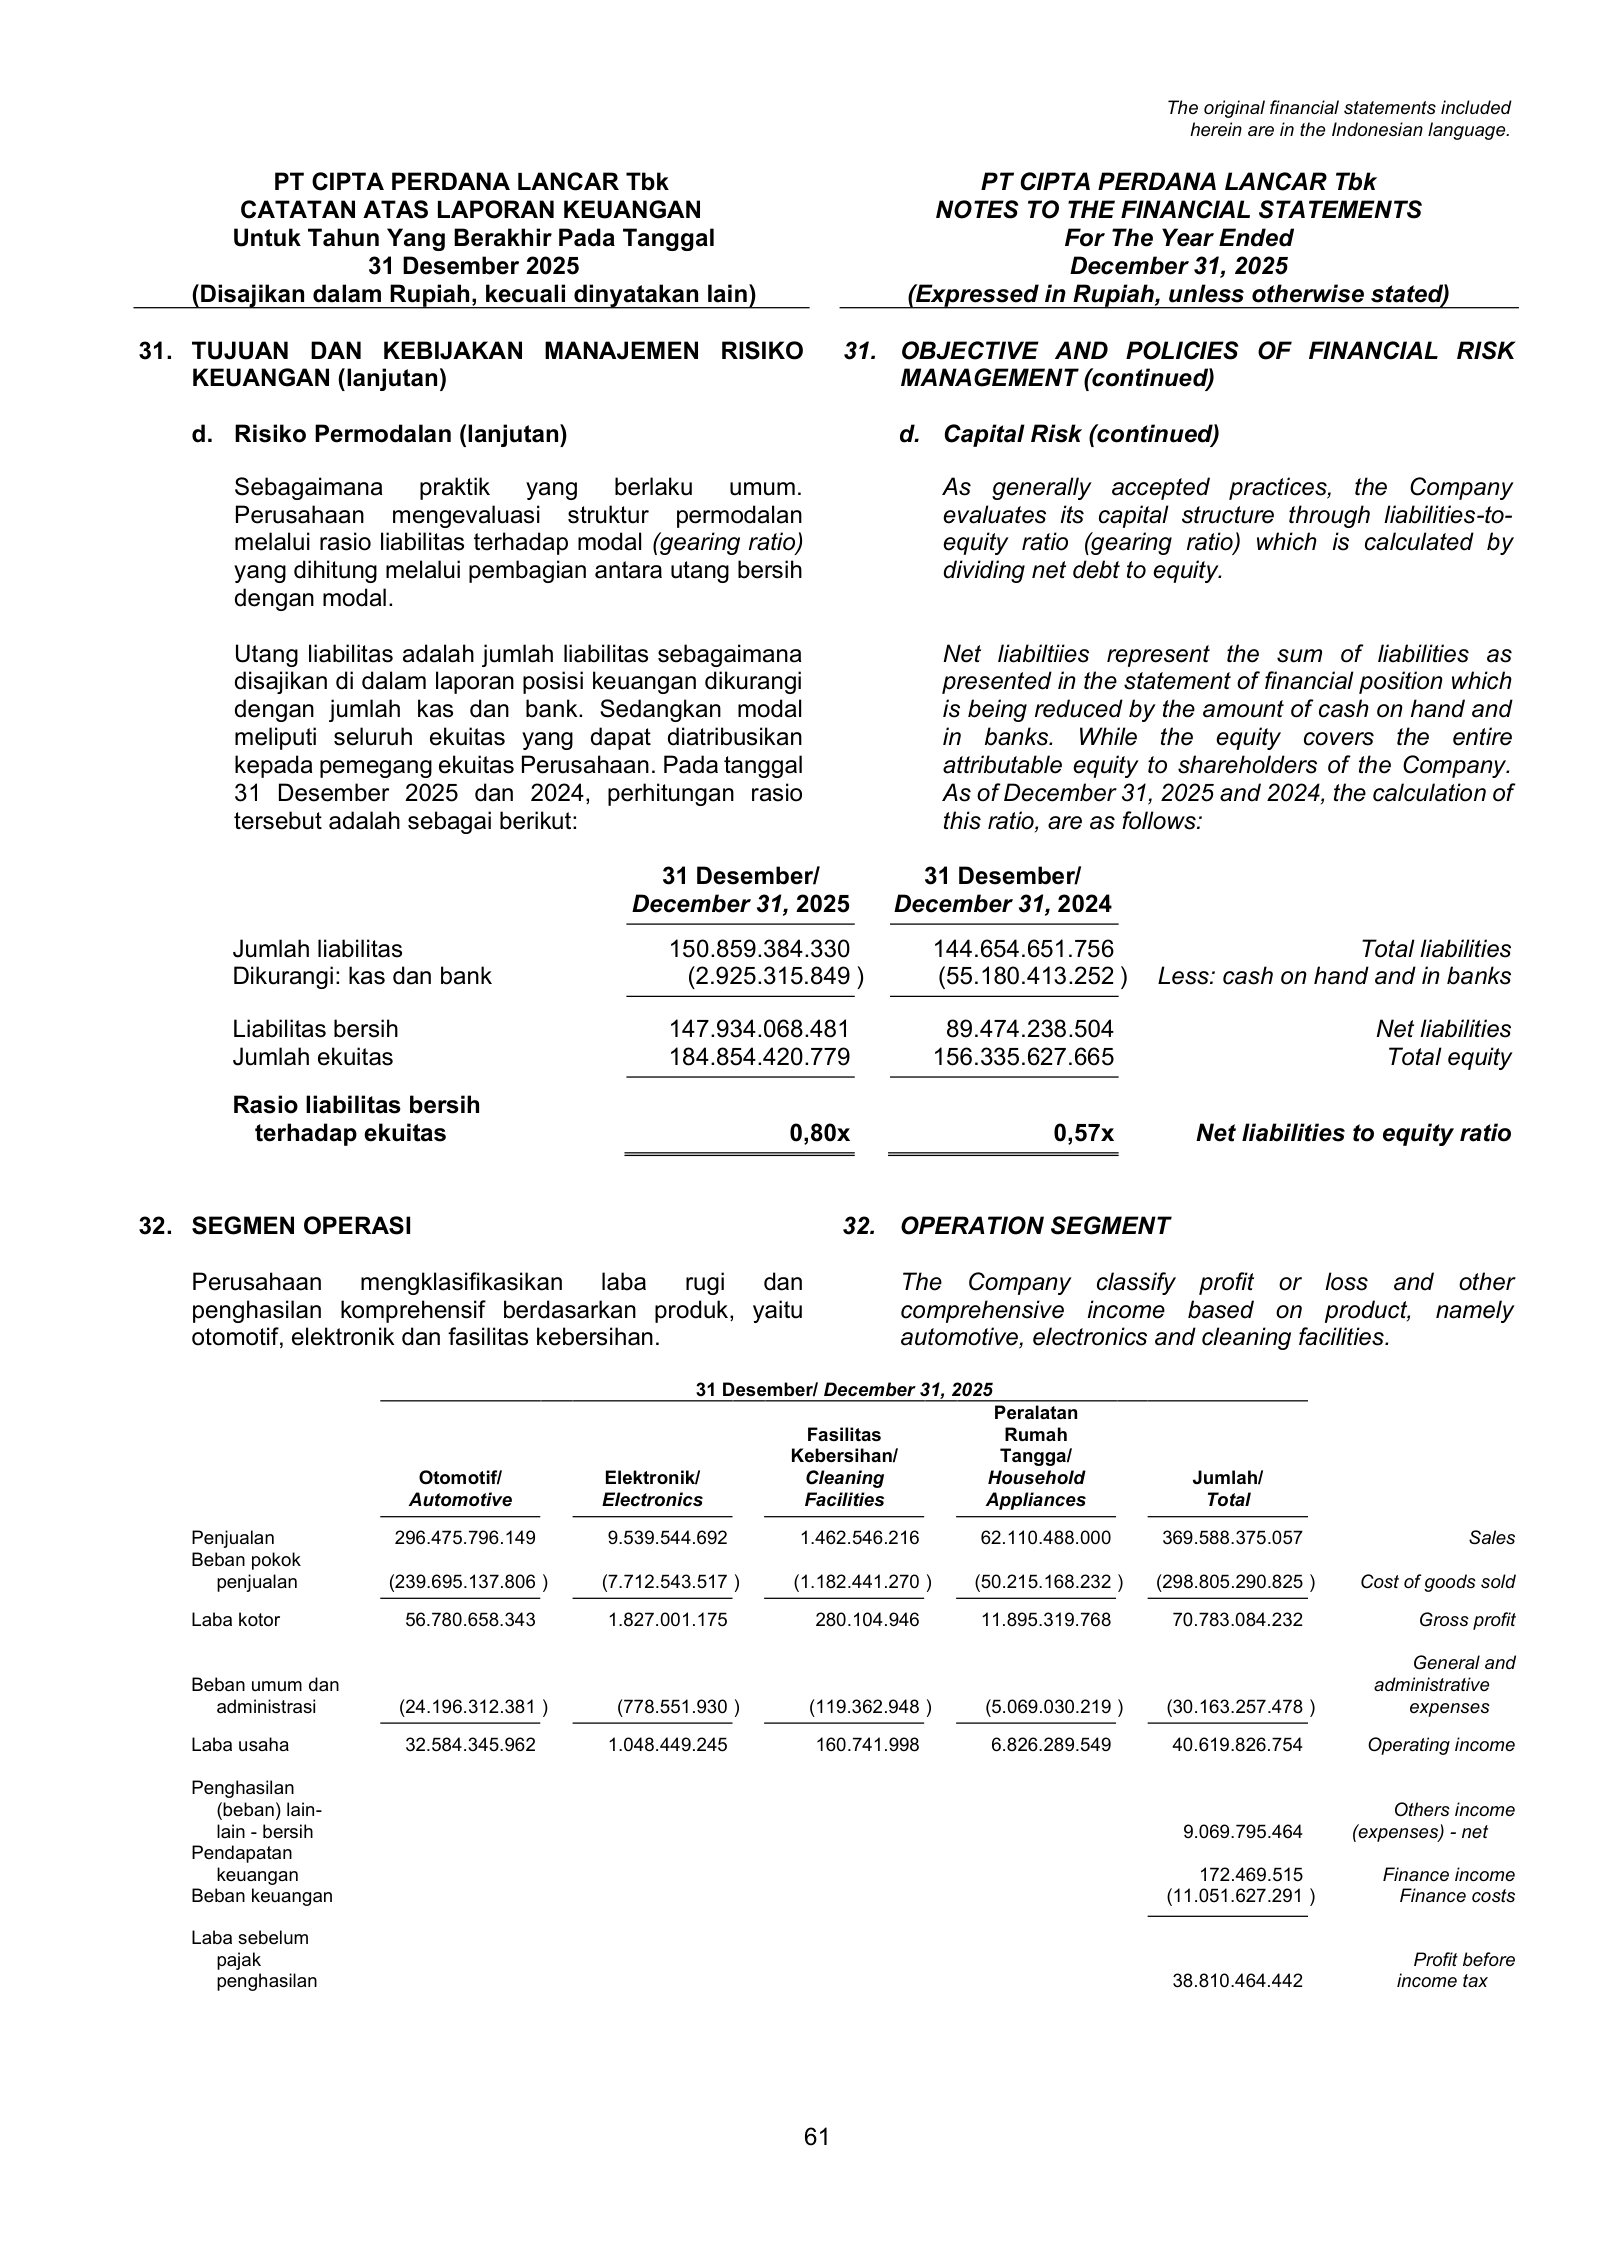
Notes to the Financial Statements — Note 32, Operation Segment — p. 247 · Read the full section →
The audited segment economics: sales, COGS and gross profit by product, showing where margins sit and the household line's first year.
More annual reports
PT Cipta Perdana Lancar Tbk — FY2024 Annual Report (Laporan Tahunan) — FY2024 · 113 pages · The IPO-year debut report: a leaner three-segment business (automotive, electronics, sanitation) before the FY2025 metal-household diversification. · Open →
Competitors describe PT Cipta Perdana Lancar Tbk's market in their own filings and calls. These verified passages and visual pages show where their strategies meet, using source documents preserved in Sources.
PT Dharma Polimetal Tbk (DRMA)
DRMA is Indonesia's largest listed automotive-components manufacturer and the subject's most direct listed peer: both make OEM parts and fasteners (bolts, nuts) for two-, three- and four-wheeled vehicles, and both extend into electrical/electronic components. Its annual reports size the shared Indonesian component market, track two-/four-wheeler demand, and lay out a market-share-led strategy across the exact segments PART supplies into. It is the only supplied peer with narrative filings (BOLT provided financial statements only).
DRMA's self-description of its business — OEM components and spare parts for two- and four-wheelers, sold B2B — names an OEM customer roster spanning nearly every major automaker in Indonesia (Honda, Yamaha, Kawasaki, Toyota, Daihatsu, Hyundai, Mitsubishi, Suzuki) plus electronics makers Epson and Polytron. This is the same 2W/3W/4W and electrical-component arena the subject operates in.
Currently, the Company manages three operating segments: two-wheels, four-wheels, and others. Its main focus is producing Original Equipment Manufacturer (OEM) components for two-wheels and four-wheels vehicles, which are marketed using a business-to-business (B2B) scheme. […] This partnership makes the Company a major supplier for leading automotive manufacturers such as Honda, Yamaha, Kawasaki, Toyota, Daihatsu, Hyundai, Mitsubishi, and Suzuki. The Company also produces spare parts for companies such as Akebono Brake, Denso, Toyodenso, Showa, and Stanley, as well as electronic equipment manufacturers such as Epson and Polytron.
p. 60 · Read in context →
DRMA's FY2025 report sizes Indonesia's motor-vehicle-component export market at more than USD5 billion and flags intensifying competition — new Chinese entrants and more aggressive pricing — alongside a rising 10–12% battery-EV share that is reshaping component demand.
The export value of Indonesia’s motor vehicle components in 2025 is estimated to reach more than USD5 billion, with a trend that continues to increase compared to the previous year. […] Along with these developments, industry dynamics were also characterized by increasing competitive intensity and changes in market structure. The presence of new players, particularly from Chinese vehicle manufacturers, as well as more competitive pricing strategies, has resulted in an increasingly open market. […] This increase also drove the electric vehicle market share to approximately 10%–12%, indicating growing consumer acceptance of more environmentally friendly mobility solutions.
p. 41 · Read in context →
DRMA attributes its FY2025 net-sales growth (Rp5.94 trillion, +7.84%) to gaining market share, concentrated in the two-wheeler segment — the segment that is also the subject's largest automotive end market.
Throughout 2025, the Company recorded net sales of Rp5.94 trillion, an increase of 7.84% compared to Rp5.51 trillion in the previous year. This increase was primarily driven by the Company’s growing market share, particularly in the two-wheeler segment. […] This reflects consistently strong demand as well as the Company’s maintained competitive position in the 2-Wheeler segment.
p. 147 · Read in context →
More peer documents
PT Garuda Metalindo (BOLT) — income statement — Multi-year · 1 page · Garuda Metalindo is the closest listed fastener peer — bolts, nuts and metal components for two- and four-wheelers, the subject's core product line. Only financial statements were supplied (no annual report or transcript); this one benchmarks the fastener business's revenue and margin trajectory. · Open →
PT Garuda Metalindo (BOLT) — financial ratios — Multi-year · 1 page · Profitability, leverage and working-capital ratios for the nearest pure fastener competitor — a quantitative reference point for how the subject's economics should look. · Open →
PT Garuda Metalindo (BOLT) — balance sheet — Multi-year · 1 page · Capital intensity, inventory and receivables of a fastener maker — useful to gauge the working-capital profile of the subject's segment. · Open →
Figures converted from Indonesian rupiah at historical FX rates — see data/company.json.fx_rates for the rate table. Ratios, margins, and multiples are unitless and unchanged.
PT Cipta Perdana Lancar: What the Company Is
PT Cipta Perdana Lancar (IDX: PART) is a founder-controlled Indonesian metal-stamping manufacturer that makes components for vehicles, electronics and household goods. It is profitable and growing — net sales reached $22.2 million and net profit $1.8 million in FY2025 [1] — but it is small, carries more bank debt than cash, and, two years past its July 2024 listing, its shares have already round-tripped from the $0.0065 offer price up to about $0.014 and back to roughly $0.006.
What it makes, and where it came from
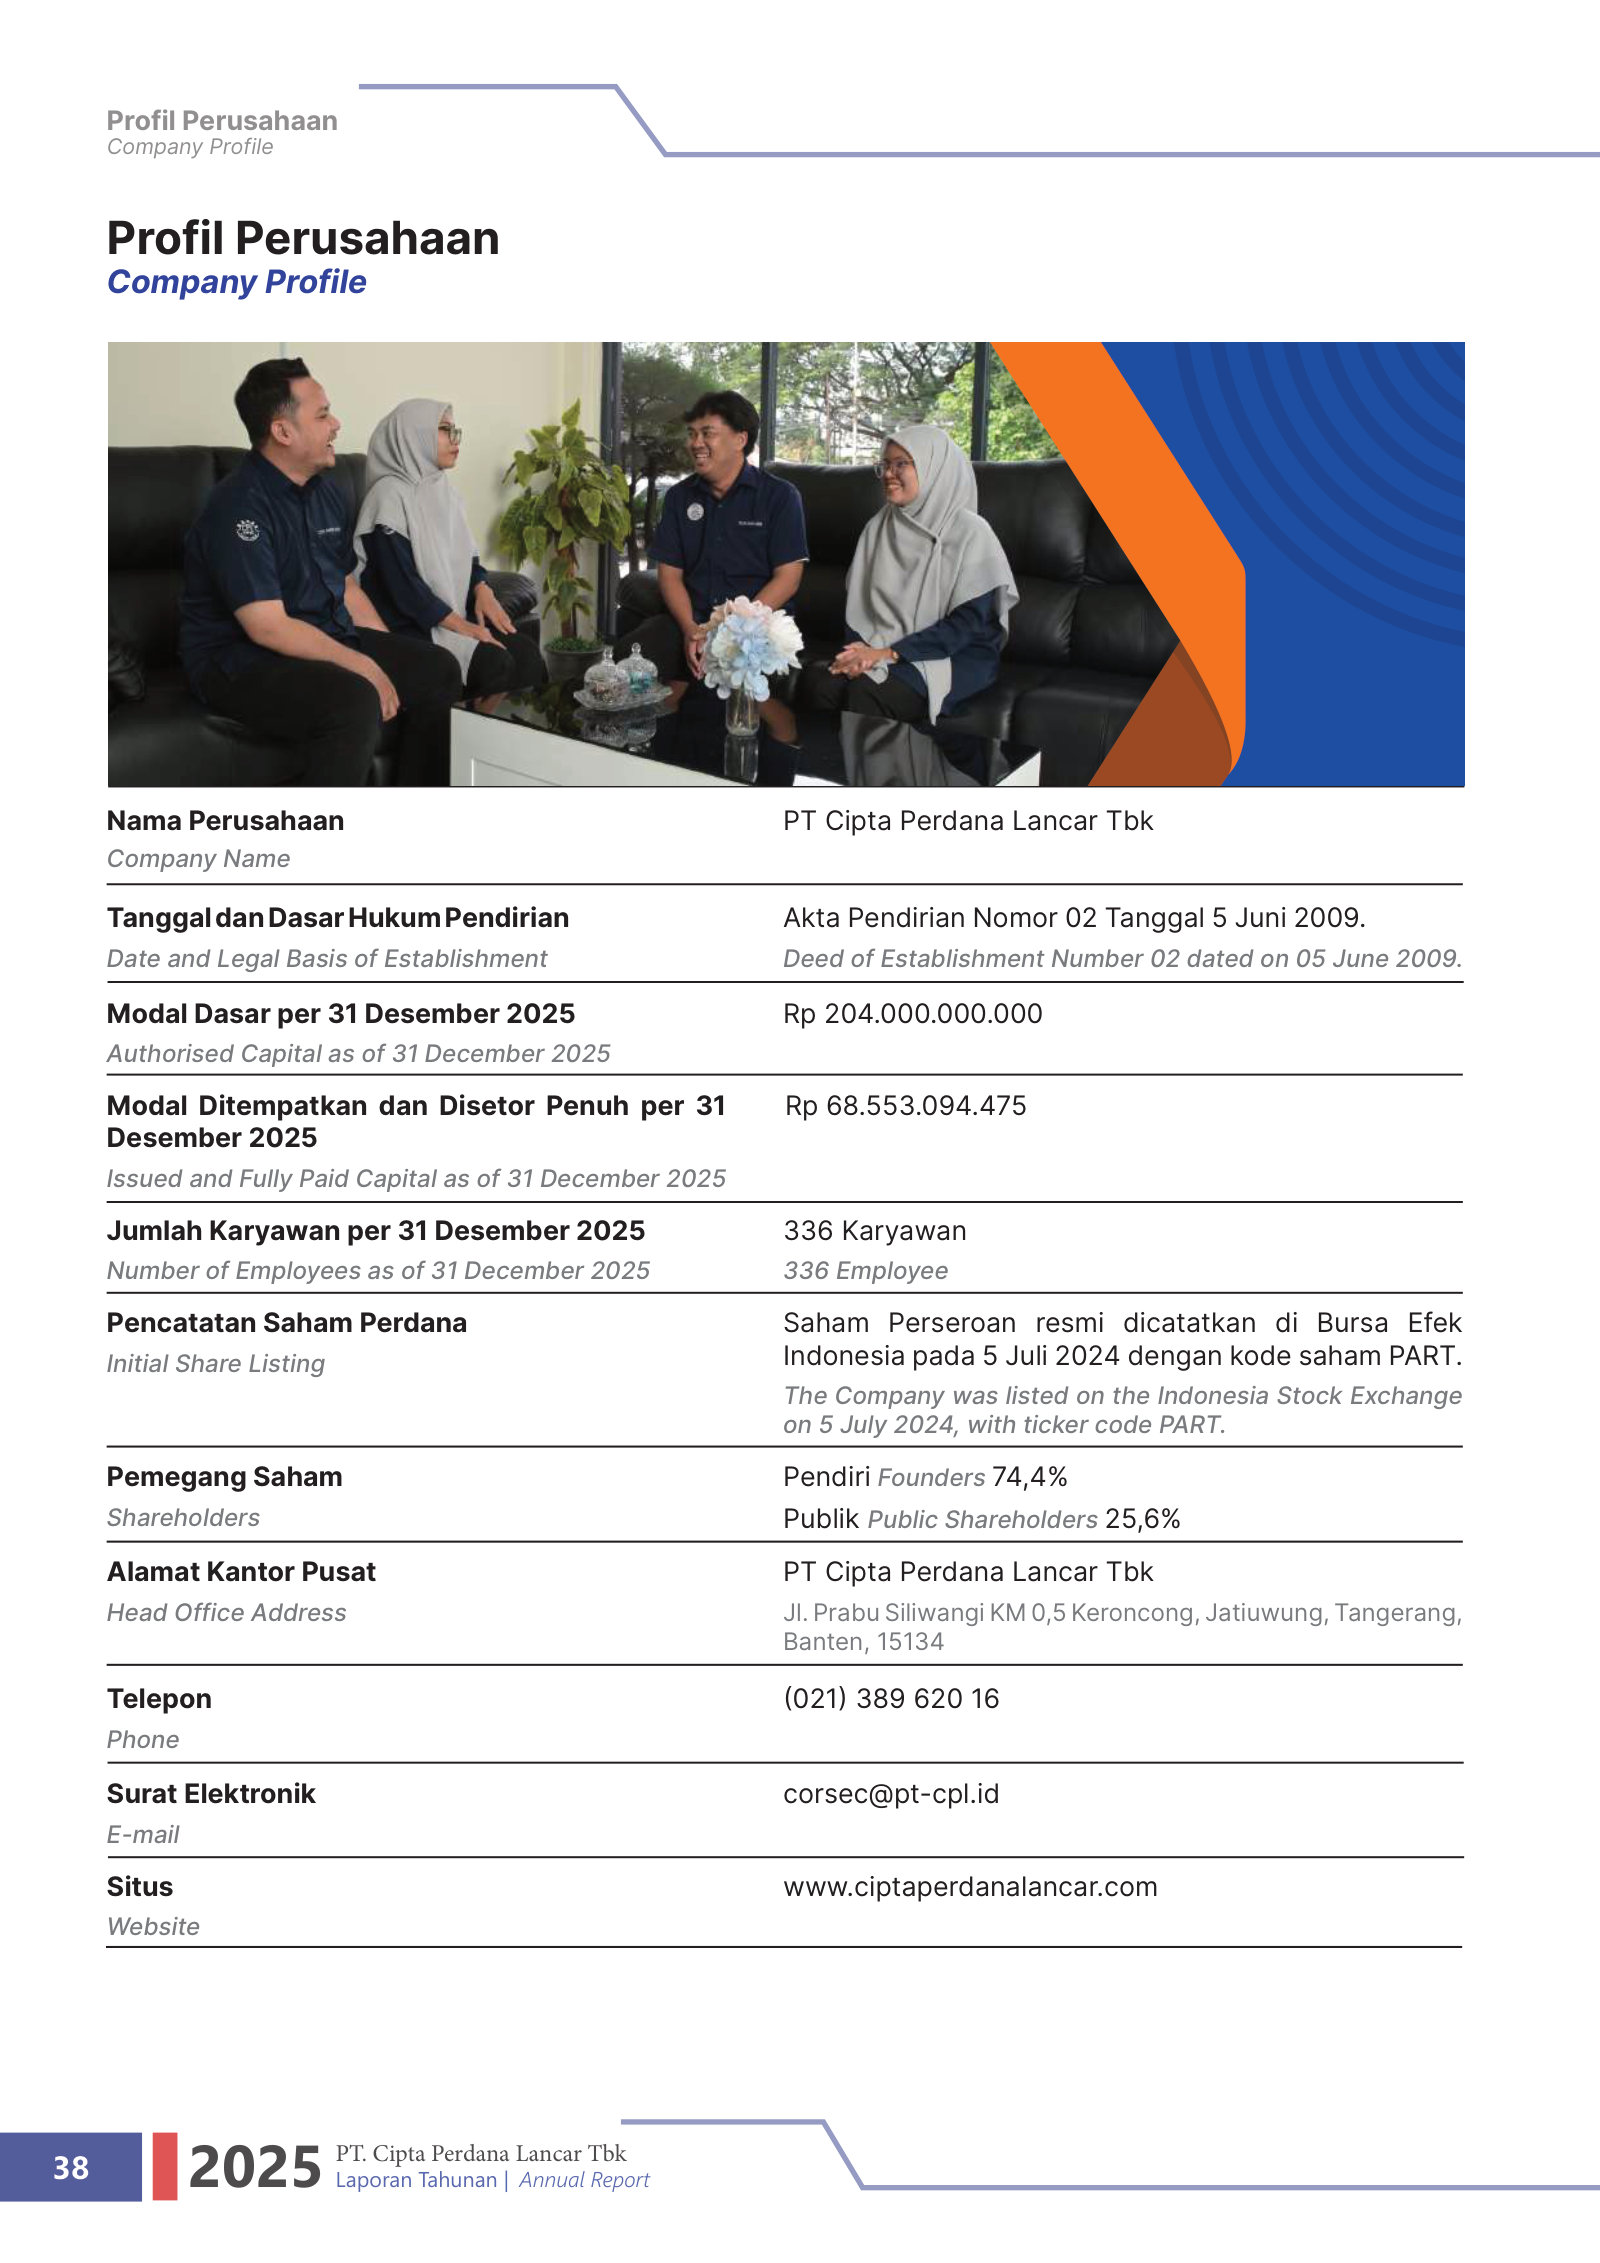
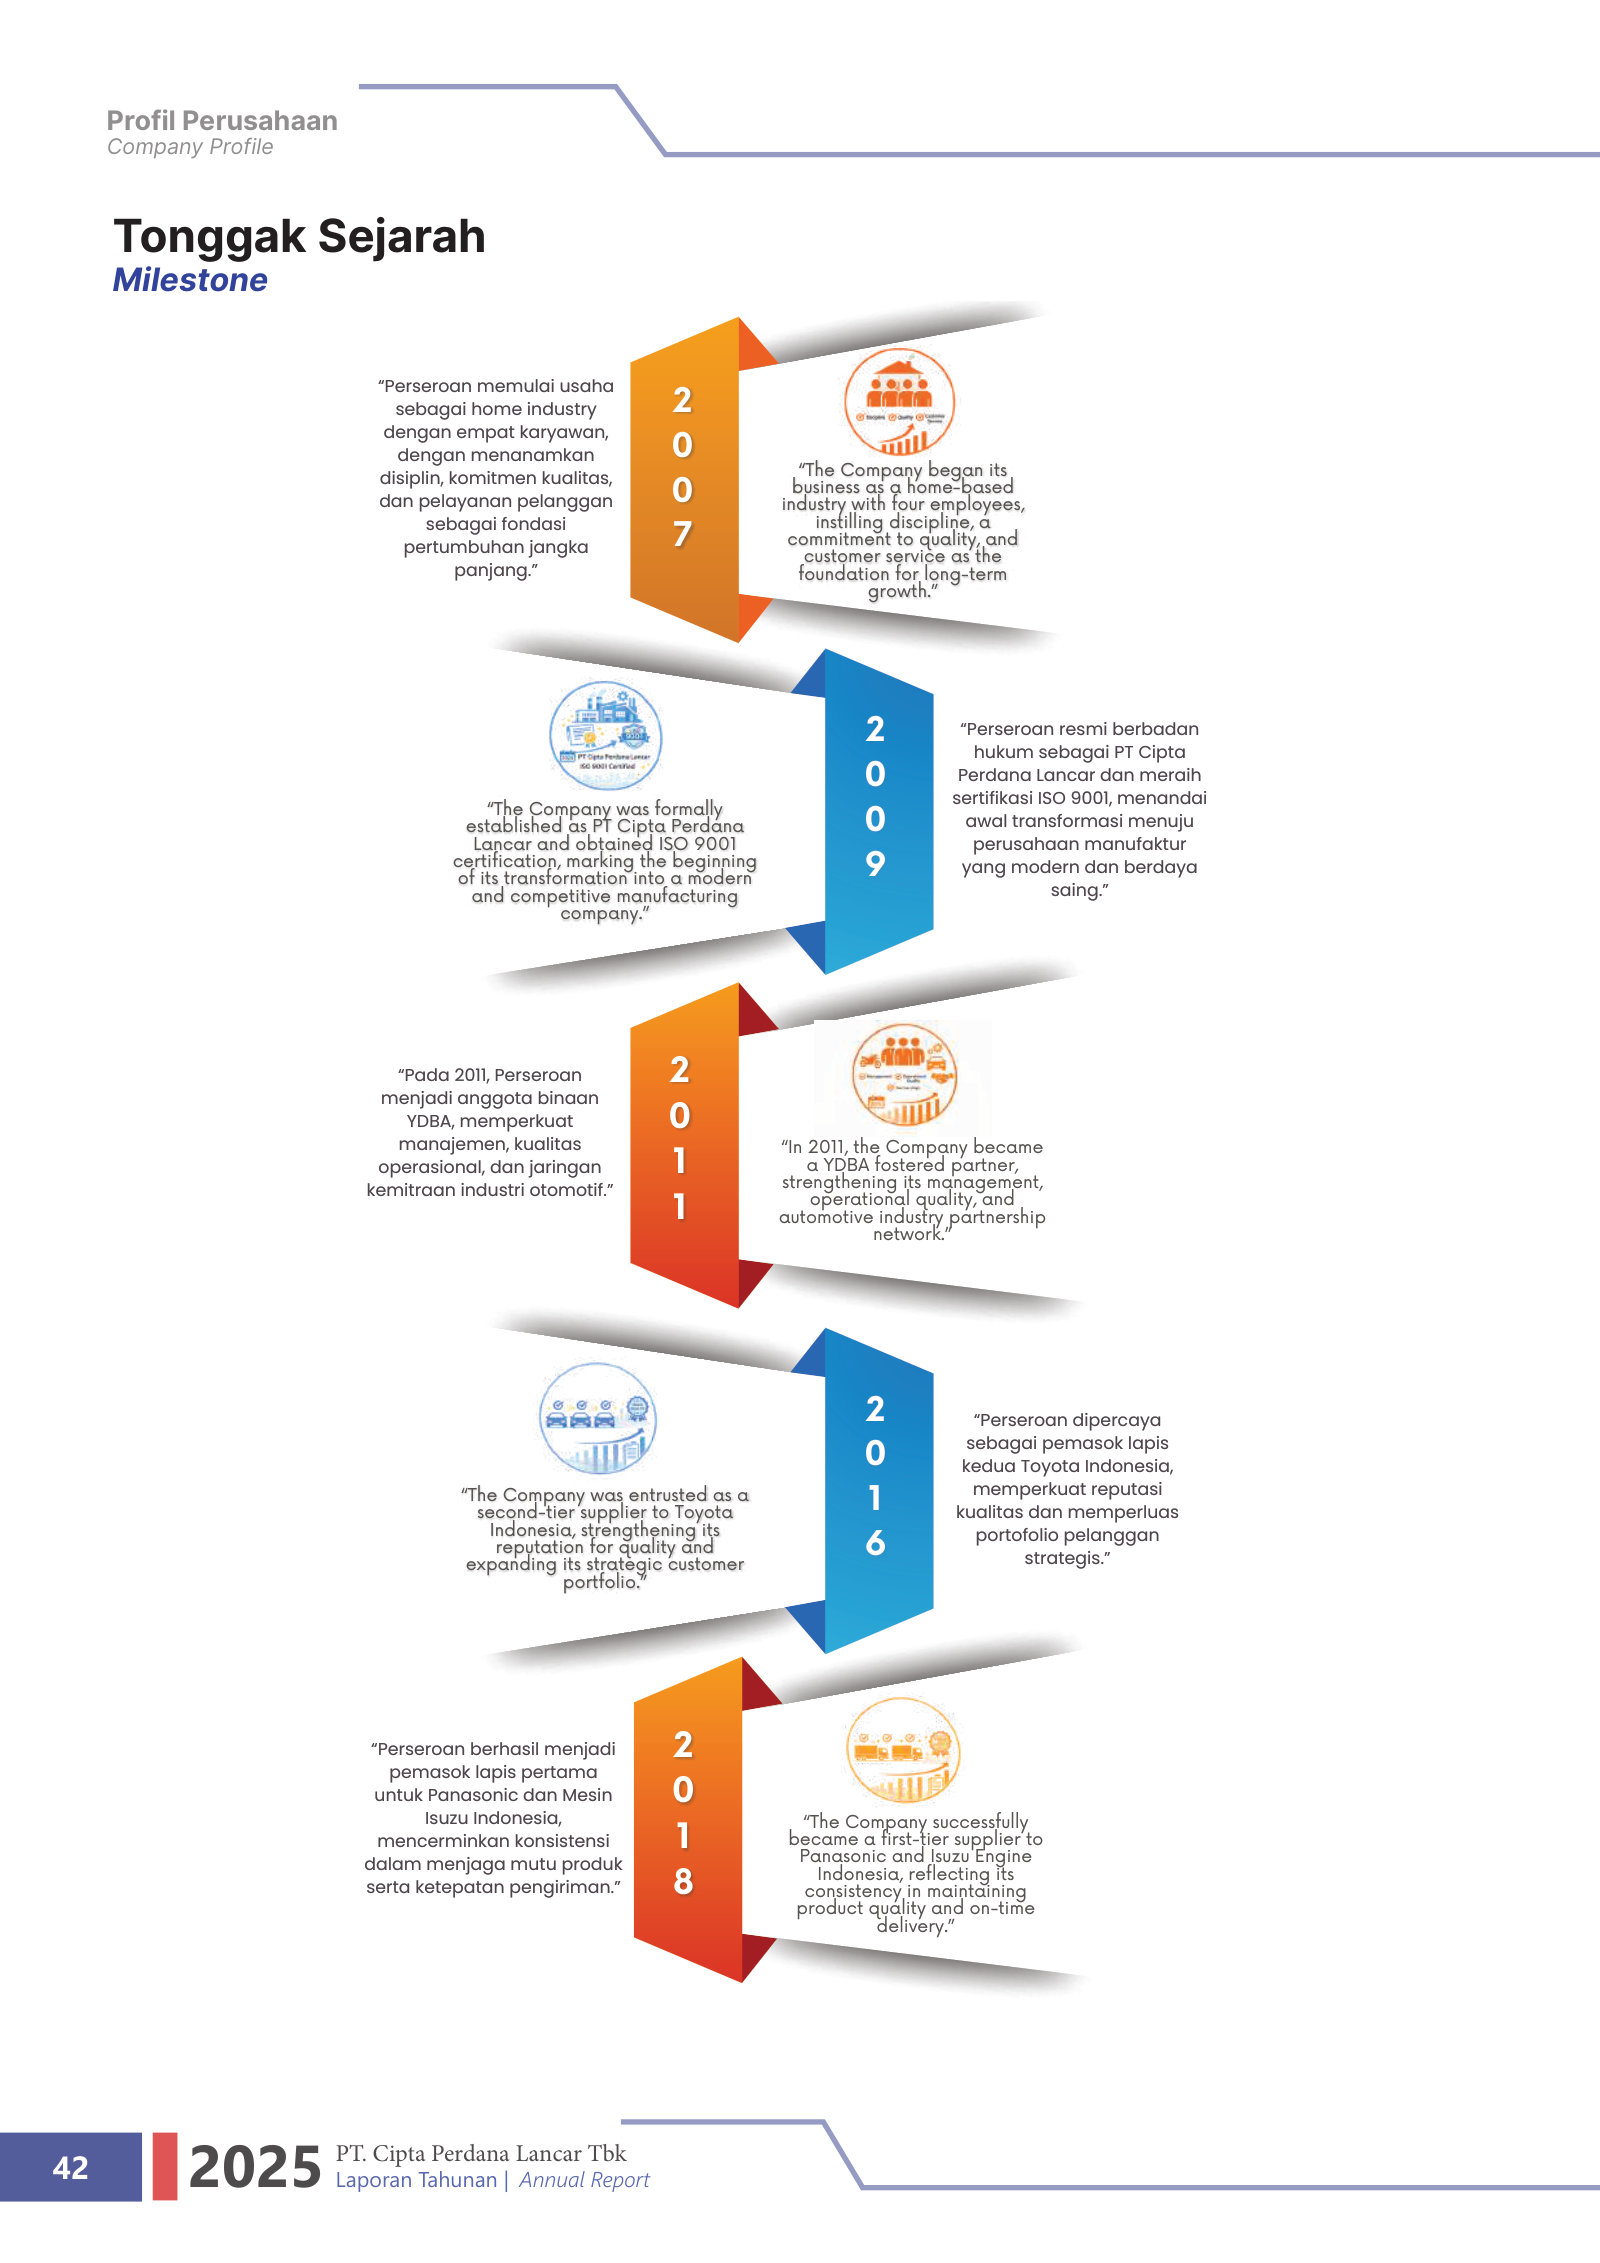
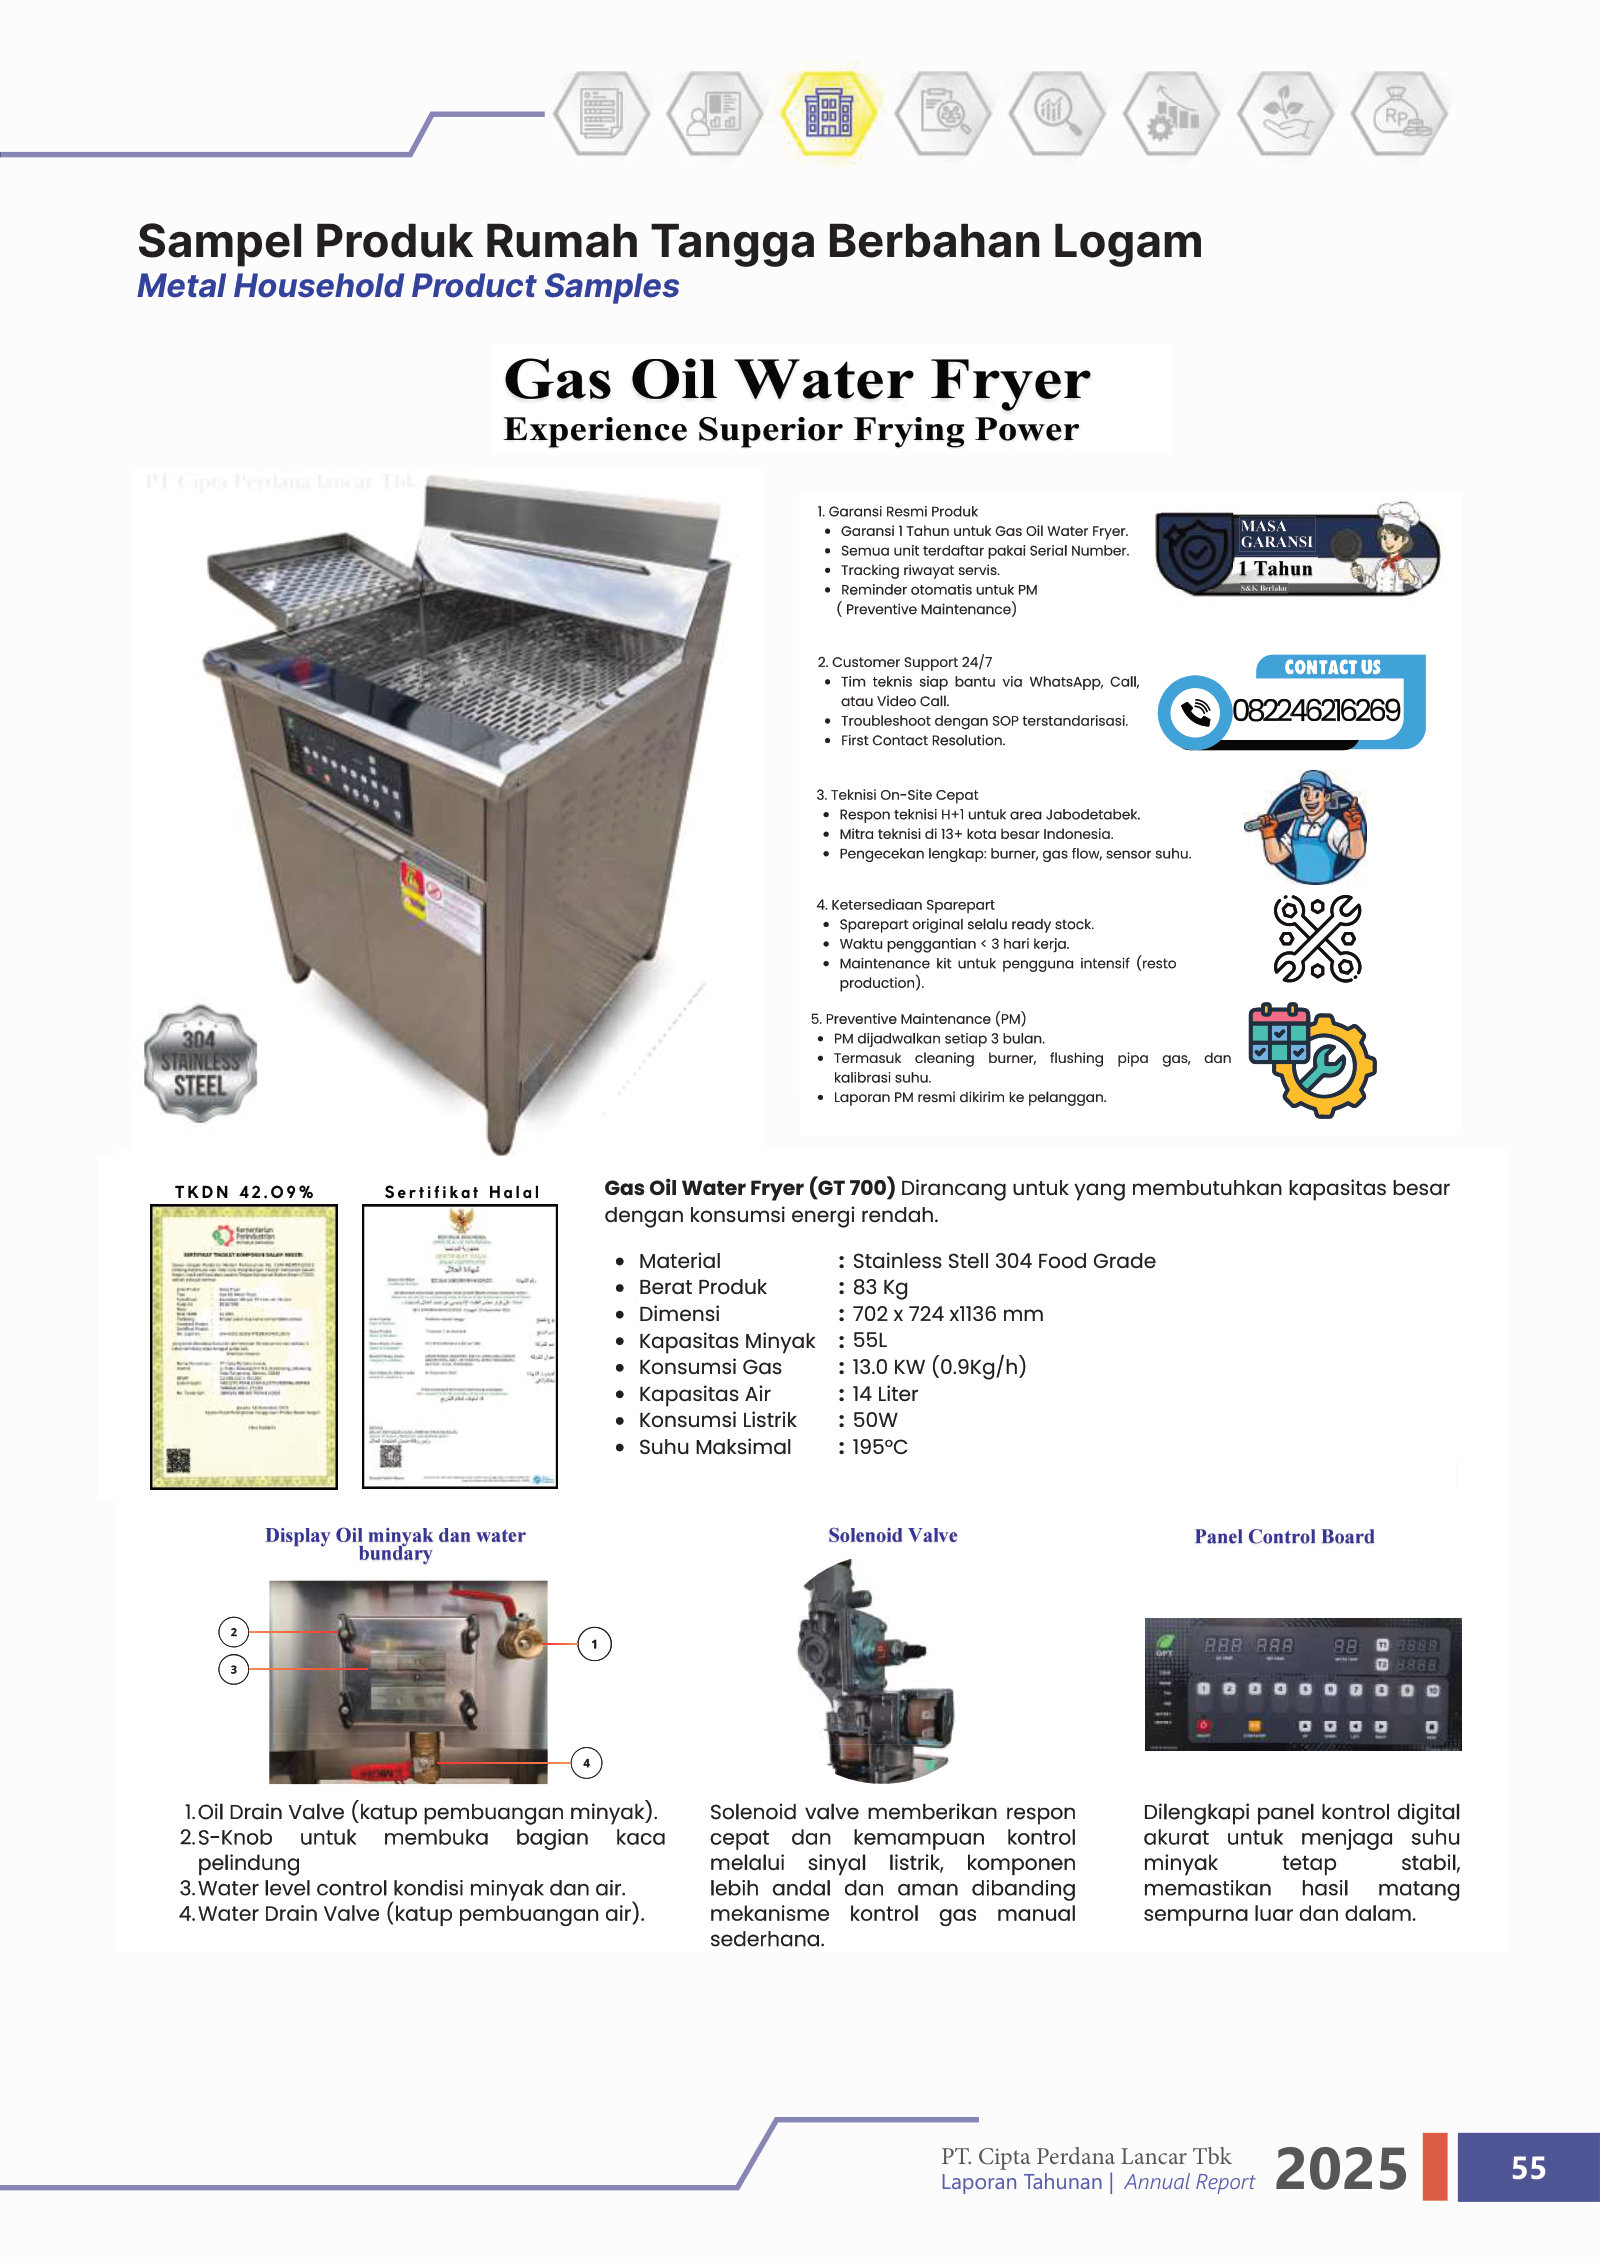
The company was founded in 2009 by Hamim — a vocational-school graduate and former machinery salesman — and is run from a single factory in Tangerang, Banten, with 336 employees at the end of 2025 [2]. Its business is metal fabrication: it designs, stamps, assembles, paints and quality-tests parts, then ships them to customers as an original-equipment supplier. Production is organised around three long-standing product lines — automotive components (two-, three- and four-wheel vehicles), electronics components, and sanitary/cleaning-equipment parts — and in 2025 the company added a fourth: metal household goods such as food trays and oil-and-water frying machines, its first deliberate step to reduce reliance on the automotive segment [3].
This is a contract manufacturer, not a brand. Its economics turn on winning and holding OEM programs, converting steel into parts at a controlled cost, and delivering on time — the "Quality, Cost, Delivery" language that recurs through its filings. That framing matters for everything that follows: the durability of the customer relationships, the capital the plant consumes, and the margin the company can defend are the levers, not pricing power over a consumer.
The scale, and the growth record
By the standards of a listed equity, PART is tiny. FY2025 revenue was $22.2 million; net profit was $1.8 million; and at $0.006 per share the whole company is worth about $16 million.
FY2025 Net Sales ($m)
FY2025 Net Profit ($m)
Return on Equity
Market Value ($m)
Sources: FY2025 net sales and net profit per FY2025 Annual Report, Financial Highlights [4]; ROE per FY2025 Annual Report, Key Ratios [5]; market value derived from 2,742,123,779 shares outstanding [6] at the reported closing price of $0.006 (exchange data, as reported).
Small does not mean stagnant. Over five years the business has nearly tripled its sales and grown profit alongside it, with only one soft year (FY2023, when net profit dipped despite higher revenue).
Source: FY2025 Annual Report, Financial Highlights (FY2023–FY2025) [7]; FY2021–FY2022 from the IPO prospectus audited accounts, as reported.
The quality of that growth is middling but real: gross margin has run near 19–22%, operating margin around 11%, and net margin near 8% [8]. Return on equity was 16.3% in FY2025, though that figure is flattered by comparison: before the IPO recapitalised the balance sheet, thin equity produced an ROE above 25% on much smaller absolute profit [9]. How much of this reported profit converts to cash — operating cash flow was well below net income in the year the plant was being built out — is a question this report will need to test, not assume.
From listing to round-trip
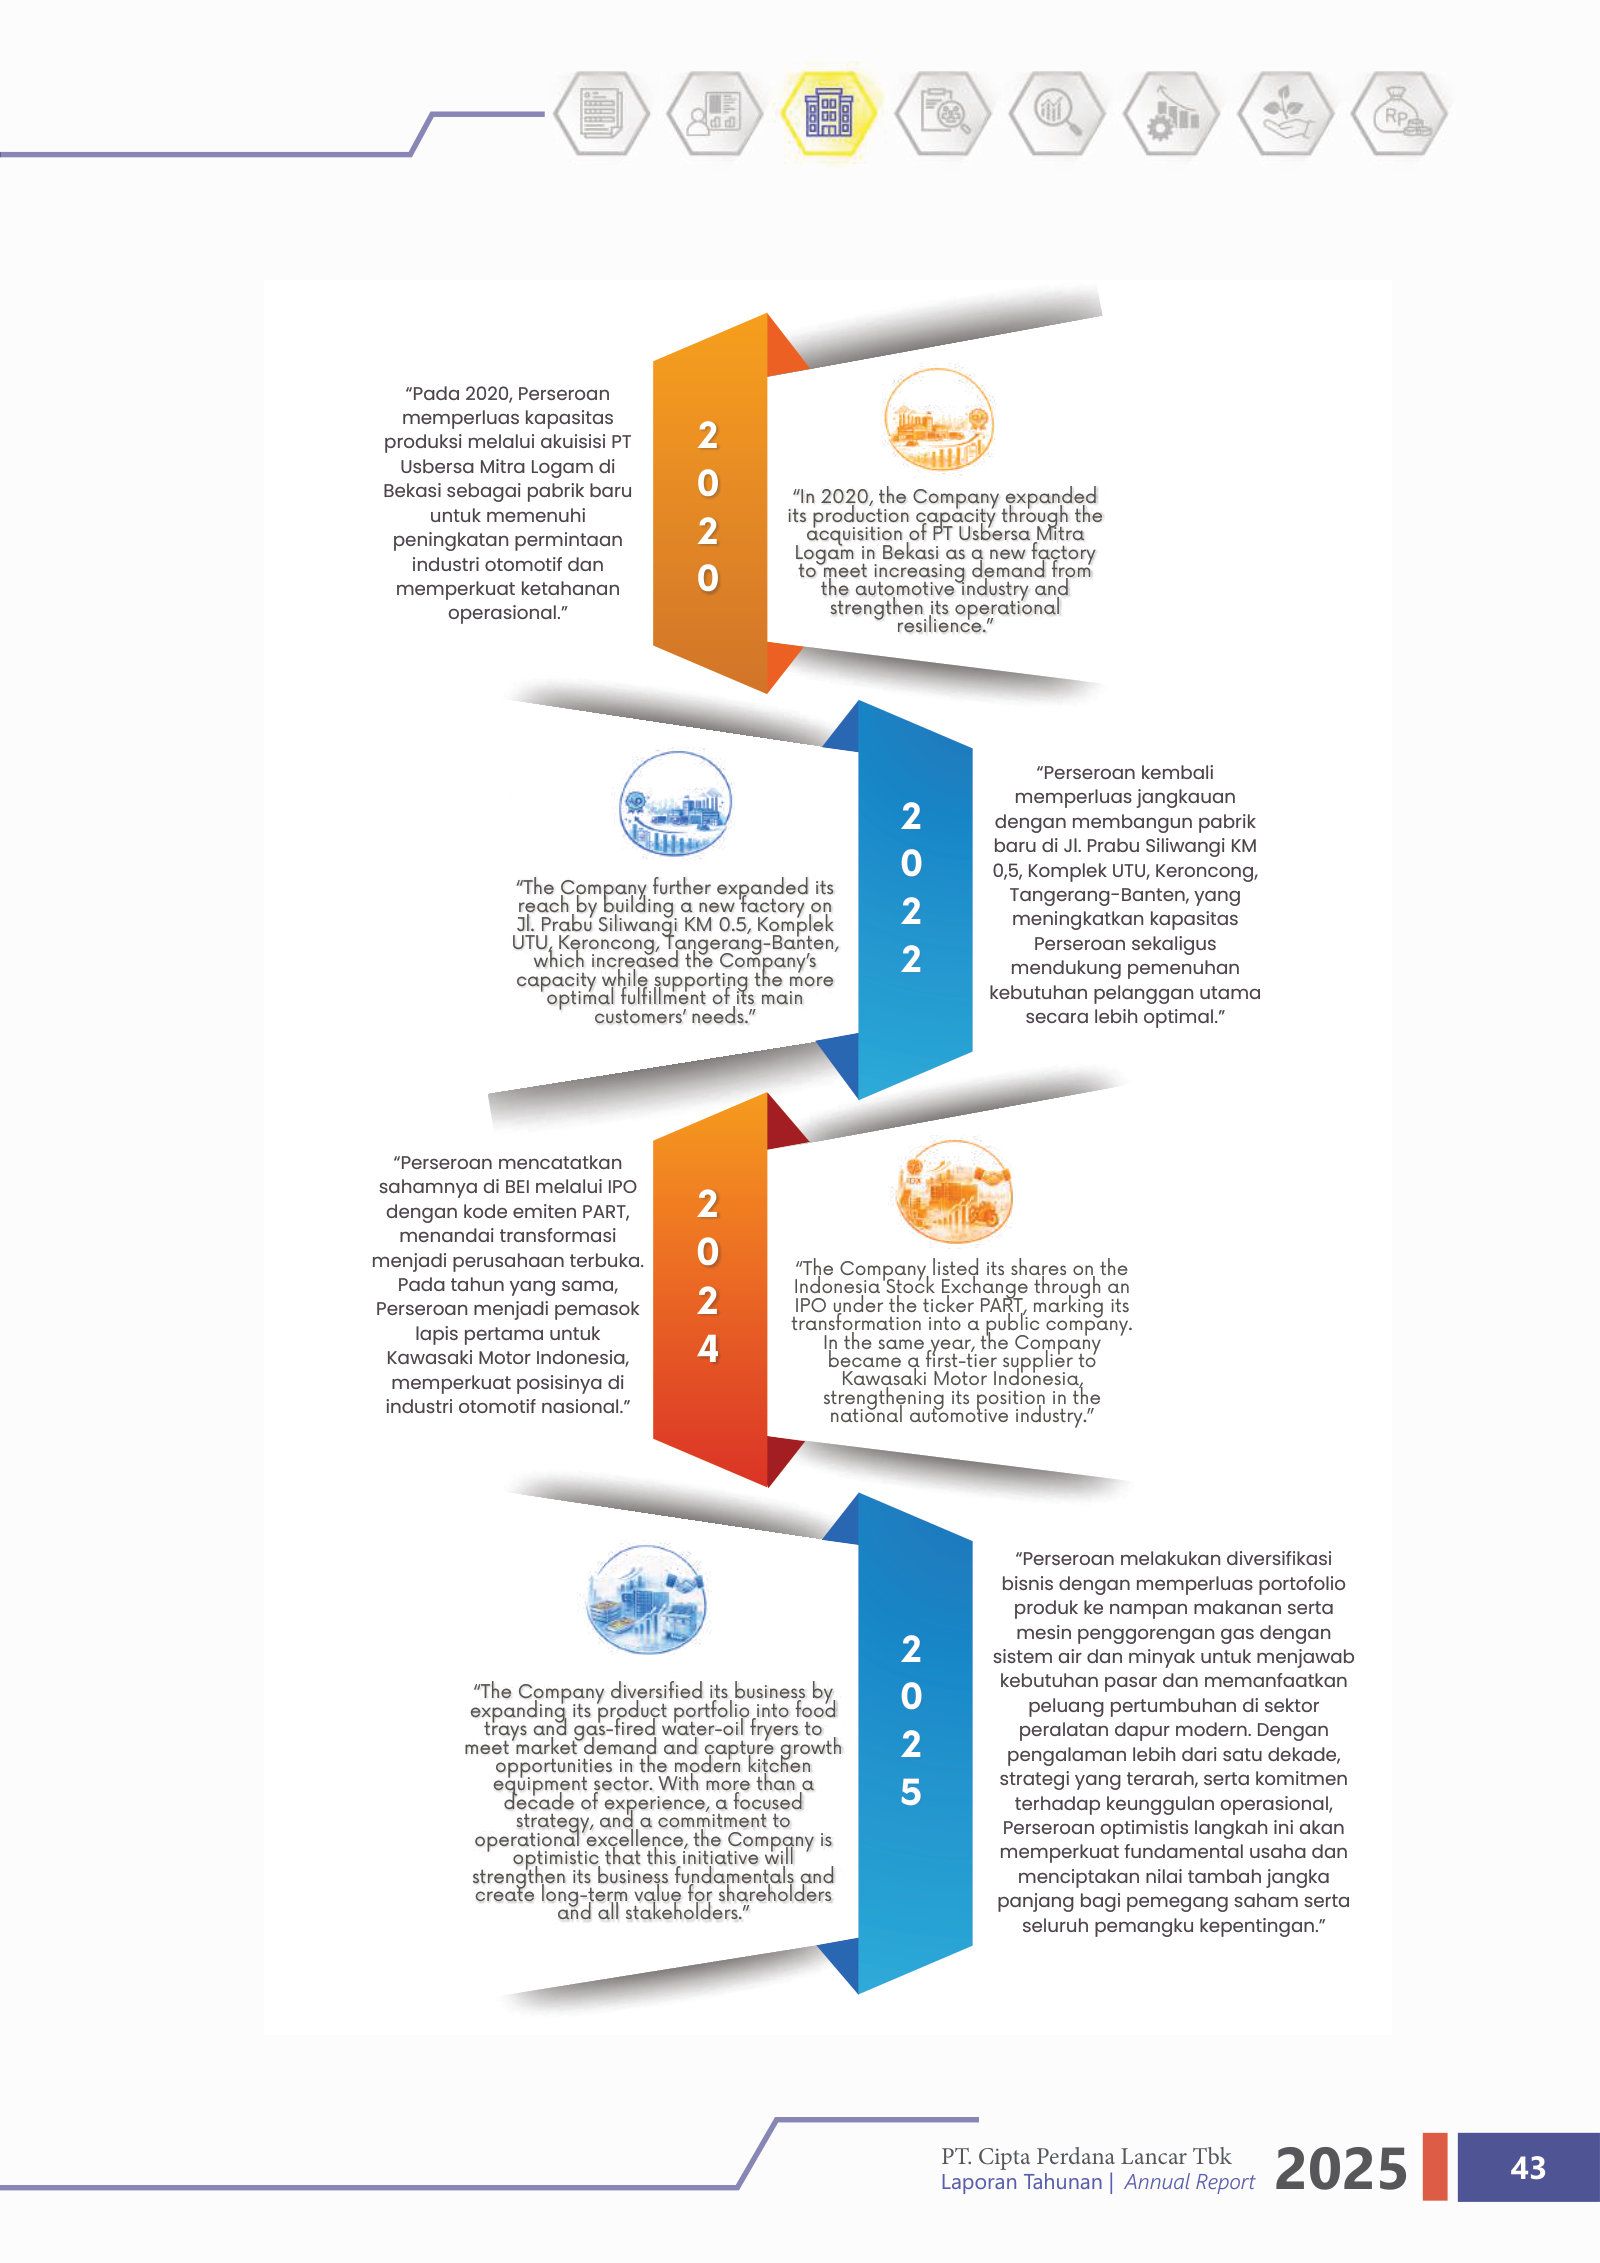
PART came to the Indonesia Stock Exchange on 5 July 2024, selling 680 million new shares — a quarter of its enlarged capital — at $0.0065 each and raising $4.4 million gross [10]. Almost all of the proceeds went into the business itself — moulding tools, production machines and working capital — rather than to selling shareholders [11]. The offer also carried one free Series I warrant per new share, exercisable at $0.0068; with the stock spending most of its life below that strike, take-up was negligible and shares outstanding rose only to about 2.74 billion before the exercise window closed in July 2026 [12]. The dilution overhang many recent Indonesian IPOs still carry is, for PART, largely spent.
The share price since has been a full round-trip rather than a trend.
Source: exchange daily closing prices (Indonesia Stock Exchange), as reported, converted at historical FX rates; IPO reference price per FY2024 Annual Report [13].
From the $0.0065 offer the stock ran to $0.0113 within weeks, sank to $0.0037 by the end of 2024, recovered through 2025, spiked to $0.0137 in February 2026, and fell back to about $0.0040 in June before settling near $0.006. That volatility is characteristic of thinly-owned Indonesian small caps and tells you little about the business; what it does establish is that the market has no settled view of what PART is worth. At $0.006 the shares trade at roughly 9–10 times FY2025 earnings and about 1.6 times book value — undemanding multiples, and close to where public shareholders started. There is no sell-side coverage and no published consensus estimate to lean on.
Ownership and the balance sheet, at a glance
Two facts frame the risk. First, this is a genuine founder company: the founding family holds 74.4% of the shares, with the public float just 25.6% [14]. Founder and chief executive Hamim runs the business he built. The alignment a minority investor wants is present; the flip side — a controlling owner whose interests a 25% float cannot outvote — is present too.
Second, the balance sheet is the pressure point. The company funds its plant partly with bank debt: against $11.1 million of equity it carries about $7.4 million of bank debt in total, of which roughly $5.9 million is long-term [15]. That works out to net debt near 2.0x EBITDA — the filings report about 1.8x, and the next chapter, Cash and Solvency, breaks the full bank-debt balance out — with EBITDA covering interest about 6 times [16]. The reported leverage looks moderate, but the liquidity behind it is thin: cash fell to $0.18 million at the end of 2025 from $3.4 million a year earlier, as the IPO proceeds were spent on capacity [17]. A profitable, cash-generative business carrying almost no cash buffer is the kind of balance sheet an investor whose stated priority is a near-zero chance of permanent loss needs to examine closely. The company did pay a maiden dividend — about $0.0001 per share, roughly $0.29 million, one-fifth of FY2024 profit — which signals confidence but also spends scarce cash [18].
The question this report will answer
Everything above sketches a company that is easy to like at a glance — founder-run, growing, cheap after a sell-off, in an industry with Indonesian localisation tailwinds — and easy to worry about on a second look — sub-scale, customer-concentrated by nature, bank-funded, and short of cash. The report exists to resolve that tension. The through-line it will follow:
Whether PT Cipta Perdana Lancar's fast, founder-controlled growth is compounding into durable value that a minority shareholder can own with a genuine margin of safety — or whether a business this small, this reliant on bank debt, and this thin on cash is too fragile to clear that bar at any price.
Answering it means testing what the surface numbers only hint at: how the money is actually made and whether the economics are improving or eroding; whether reported profit becomes cash; how safe the balance sheet really is under stress; and whether the founder's control works for minority holders or around them. The evidence for each is in the filings; the work is to weigh it.
Cash and Solvency
Figures converted from Indonesian rupiah at historical FX rates — see data/company.json.fx_rates for the rate table. Ratios, margins, and multiples are unitless and unchanged.
Across FY2023–FY2025, PT Cipta Perdana Lancar grew revenue 55% and net profit 89%, yet converted only about half of recent profit into operating cash and spent more on plant than it earned in every one of those years. The July 2024 IPO handed it a $3.4 million cash cushion; eighteen months later $0.17 million was left. The business rests on $7.4 million of bank debt from a single lender, secured on its machinery and personally guaranteed by the founder.
Three years of financials
The income statement reads well. Revenue rose from $15.5 million in FY2023 to $22.2 million in FY2025 [1], a 38% jump in the latest year alone. Operating profit climbed to $2.4 million and net profit to $1.8 million [2]. Net margin has held in a narrow 6.7%–8.9% band for four years — the steady signature of a contract manufacturer that passes steel cost through to price.
Source: FY2025 Annual Report, Statements of Profit or Loss [3]; pre-FY2024 figures as reported in the 2024 IPO Prospektus.
One caution on per-share figures: the share count is not comparable across the listing. The company carried 51 million shares at end-2023, split the Rp1,000 par value to Rp25, and issued IPO stock — leaving 2.72 billion shares by end-2024 [4]. Reported earnings per share therefore fall from Rp25.67 in FY2023 to about Rp11 in FY2025 purely on the larger base; absolute profit, not EPS, is the honest scorecard here.
Source: FY2025 Annual Report [5]; pre-FY2024 figures as reported in the 2024 IPO Prospektus.
A quieter feature of the profit is worth naming. Of $2.33 million of pre-tax profit in FY2025, $0.55 million — 23% — came from scrap sales booked as other income, roughly the same $0.60 million earned the year before [6]. For a metal stamper, offcut scrap is genuinely recurring, so this is not a one-off dressing up the year; but it is a non-core line that has stopped growing while revenue rose 38%, and it happens to offset most of the $0.67 million finance cost [7]. Strip it out and pre-tax profit from making parts is closer to $1.78 million.
Profit that only half-turns to cash
The gap between reported profit and cash generated is the more important story, and it has widened. In FY2023 the company turned $1.04 million of net profit into $1.66 million of operating cash — a healthy 1.6 times [8]. In FY2024 and FY2025 that ratio collapsed to 0.60 and 0.51: operating cash flow of $0.86 million and $0.93 million against net profit of $1.44 million and $1.81 million [9].
Source: FY2025 Annual Report, Statements of Cash Flows [10]; FY2023 from FY2024 Annual Report [11].
The mechanism is inventory, not an accounting trick. Depreciation of $1.10 million [12] should lift operating cash above profit; instead, total inventory doubled from $1.91 million to $3.73 million during FY2025, an outflow of $1.88 million that absorbs the entire depreciation add-back and more [13]. Almost all of it is finished goods, which jumped nearly nine-fold from $0.30 million to $2.53 million [14]. Management booked no obsolescence provision against it [15].
That build has two readings, and the evidence does not yet settle between them. Finished goods staged for known early-2026 deliveries would be a benign working-capital timing effect; goods produced ahead of demand that softened would be the start of a write-down risk. The first-quarter 2026 revenue run-rate of about $5.3 million, reported after year-end, annualises close to the FY2025 level and leans toward the benign reading — but a finished-goods position this large, carried at full cost, is the first line a skeptic should watch in the next audited accounts.
The IPO cushion, spent in a year
Once capital spending is included, the company has not funded itself from operations in any of the last three years. Free cash flow — operating cash less capital expenditure — was negative $1.53 million in FY2023, negative $1.10 million in FY2024, and negative $3.39 million in FY2025, as capex ran to $4.3 million in the latest year against $0.93 million of operating cash [16]. Cumulatively, the three years consumed roughly $6 million of cash beyond what operations produced.
Source: FY2025 Annual Report, Statements of Cash Flows [17]; FY2023 from FY2024 Annual Report [18].
The July 2024 IPO raised $4.4 million of primary capital and briefly changed the picture: cash on the balance sheet went from $0.05 million at end-2023 to $3.42 million at end-2024 [19]. That cushion was not durable. At end-2024, $3.35 million of the $3.42 million sat in a single Bank Victoria account — the parked IPO proceeds — and by end-2025 that account was empty, leaving $0.17 million spread across small operating balances [20]. Management confirmed the proceeds were fully deployed on capex and operations by 31 March 2025 [21]. In effect, one year of expansion absorbed the entire equity raise.
Source: FY2025 Annual Report, Note 4 [22]; pre-FY2024 balances as reported in the 2024 IPO Prospektus.
A single-lender debt stack
The financing that fills the gap deserves a closer look than the headline leverage ratio suggests. Total bank debt was $7.4 million at end-2025, up from $7.2 million a year earlier — a figure that includes a $0.14 million short-term loan and $1.3 million of long-term debt maturing within twelve months, on top of the $6.0 million long-term portion [23]. Against $3.5 million of EBITDA (operating profit plus depreciation), net bank debt of about $7.2 million is roughly 2.0 times — moderate on its own, and covered a little over 5 times at the EBITDA line and 3.7 times at operating profit by the $0.67 million interest bill.
Three features make the structure more concentrated than those ratios imply. Every facility is with one bank, PT Bank Central Asia; there is no second lender and no bond [24]. The loans are secured on the company's land, machinery (a minimum $2.6 million list) and trade receivables (a minimum $0.6 million), and carry a personal guarantee from founder-CEO Hamim up to the full facility limit [25]. And BCA imposes affirmative covenants: a range of corporate actions require the bank's written consent [26]. The founder's personal guarantee is a genuine alignment signal, with his own assets on the line, but it also concentrates the company's entire financing in one lender's relationship with one family.
The maturity ladder itself is manageable. Most of the investment credits — funding dies, machines, land and factory buildings at 8%–9% — are termed out to 2030–2033 [27]. The near-term pressure sits in two $0.9 million working-capital lines — a local credit and a receivables-financing revolver — both maturing 12 June 2026 [28]. BCA has rolled and expanded these facilities before, most recently amending the agreement in June 2025 [29].
Source: FY2025 Annual Report, Note 14 Bank Loans [30].
Reading the solvency risk
For a reader whose first priority is a near-zero chance of bankruptcy, the picture is genuinely two-sided, and precision matters more than a label.
On the reassuring side, current assets of $6.55 million cover current liabilities of $2.67 million 2.45 times, the equity base of $11.1 million is larger than total liabilities of $9.05 million [31], and the debt is long-dated, asset-backed and cheap [32]. Interest is covered comfortably from operating profit, and the founder's personal guarantee gives the lender a reason, and the borrower every incentive, to keep the relationship intact.
Cash ($m)
Debt Due within 1yr ($m)
Net Debt / EBITDA
Current Ratio
Source: FY2025 Annual Report, Notes 4 and 14 [33] [34].
On the exposed side, the cash buffer is thin against near-dated obligations. About $1.45 million of bank debt matures within twelve months, and cash of $0.17 million covers only 12% of it [35]. The comfortable current ratio depends on realising $3.73 million of inventory — most of it finished goods carried at full cost with no obsolescence reserve — and roughly $1.8 million of receivables into cash on schedule [36]. With operations not self-funding and the equity raise spent, the company depends on BCA continuing to roll the June-2026 working-capital lines and to fund the next capex cycle.
The balanced read: this is not a business on the edge of default — leverage is moderate, maturities are laddered, and the founder is personally committed. But it is a business with almost no liquidity margin of safety, one whose solvency runs through a single bank relationship and through the timely conversion of a swollen inventory. The condition that would move this from "watch" to "worry" is concrete, and its parts are correlated rather than independent. The bear case and the refinancing wall are one event: a FY2026 in which the Badan Gizi order does not recur is also the year the $2.53 million inventory does not convert, even as ~$1.45 million of BCA debt matures against $0.17 million of cash — the scenario developed in Scenarios and Watch Items.
Cash of $0.17 million covers 12% of the $1.45 million of bank debt due within a year. The current ratio of 2.45x that offsets this depends on converting a finished-goods inventory that jumped nearly nine-fold in FY2025, carried with no obsolescence provision.
The forward view, without a consensus
No sell-side analyst covers PART. Yahoo Finance, Simply Wall St and Investing.com each show zero estimates and no price target, so there is no consensus to lean on — the forward view has to be built from the company's own record and capacity. First-quarter 2026 revenue came in around $5.3 million; annualised, that is close to the FY2025 pace and points to growth in the high-single to low-double digits rather than a step-change, unless the new metal food-tray line scales faster than the base.
Management's own forward framing calibrates how much optimism to apply. At the June 2025 Public Expose, the company engaged publicly with a $60 million revenue target for 2025 and set aside $3.0–4.2 million of capex — funded from cash and bank loans — to pursue it [37]. Actual FY2025 revenue was $22.2 million, less than 40% of that figure [38]. The capex guidance proved accurate — $4.3 million was spent — but the revenue ambition missed by a wide margin. A reader building a base case should discount management's top-line aspirations heavily and anchor instead on the demonstrated run-rate and the capacity that heavy capex is adding.
The reasonable base case, then: mid-teens revenue growth off the FY2025 base as new capacity fills, margins steady near 8%, continued capex in the $3.0–4.2 million range, and — the load-bearing consequence — free cash flow that stays negative and a balance sheet that keeps leaning on BCA until operating cash catches up with the investment programme. When capital spending normalises toward maintenance levels, the same operating cash could turn free cash flow positive quickly; that inflection, not the reported profit line, is the variable that most affects value here.
What would change the read
Three line items, each checkable in the next audited accounts, decide whether the fragility eases or hardens:
- The June-2026 refinancing. Renewal of the two $0.9 million BCA working-capital lines on similar terms confirms the single-lender relationship holds; any tightening or non-renewal is the fastest route to stress [39].
- The finished-goods inventory. A drawdown of the $2.53 million finished-goods balance into cash validates the benign reading; a further build, or a first obsolescence provision, validates the bearish one [40].
- Capex versus operating cash. The year capex falls back toward the $1.1 million depreciation run-rate while operating cash holds is the year free cash flow turns positive and the reliance on debt ends [41].
The financials that satisfy this report's required questions ([sec-00013], [sec-00014], [sec-00019]) therefore describe a profitable, fast-growing operation whose reported earnings are real but whose cash is fully committed to growth and whose safety depends on one bank and one inventory conversion. Whether that clears a margin-of-safety bar is a question the valuation and industry chapters have to answer against the price.
Figures converted from IDR at historical FX rates — see data/company.json.fx_rates. Ratios, margins, and multiples are unitless and unchanged.
Alignment and Control
A single family owns 74.4% of PT Cipta Perdana Lancar and fills the top of both boards. The alignment is unusually literal: the founder personally guarantees every bank loan, and family land secures it. The extraction channels are modest — board pay is 9.3% of profit with no equity dilution, and the affiliate funding that ran the company before listing has been wound down to near zero. The check on the controller runs through incentives, not through any power the minority holds.
For the 25.6% minority, two possibilities are in play: shares held alongside an owner-operator whose own wealth is committed to the company, or alongside a controller who can direct its assets with little to check him. The disclosed record points one way more than the other.
Family control
Public float
Board + commissioner pay ($m)
Pay as % of net profit
Sources: FY2025 Annual Report, Note 20 Share Capital [1] and Note 29 remuneration [2]; pay-to-profit derived from FY2025 net profit of $1.8m.
The control stack
Two layers put the same three people in charge. A private holding company, PT Cipta Investama Lancar, directly owns 54.56% of PART; the three founders then hold another 19.84% in their own names — Hamim, the founder-CEO, 9.92%; Nenden Widiastuti 7.94%; Syamsiah 1.98% [3]. The holding company is itself owned only by those same three, split Hamim 50.00%, Syamsiah 33.33%, Nenden 16.67% [4]. Combined, the family controls 74.4% and the public float is 25.6% [5].
Source: FY2025 Annual Report, Note 20 Share Capital [6]; controlling-shareholder classification p.71 [7].
The three are one family. The filings disclose, for each of them, a "family relationship" with the other two: Hamim with the President Commissioner and a commissioner [8], and Nenden with the President Commissioner and the President Director [9]. Looking through the holding company, Hamim is the dominant economic owner with roughly 37% of PART, well ahead of the other two.
Source: derived from FY2025 Annual Report ownership diagram, p.72 [10]; look-through = direct stake plus holdco stake times 54.56%.
That block clears every practical governance threshold on its own. A 74.4% holder carries any ordinary resolution and the two-thirds majority needed to change the articles of association — as it did at the 11 August 2025 extraordinary meeting that added a metal-household-goods business line — and sits just under the three-quarters level associated with the largest corporate actions [11]. The family stake eased from exactly 75.0% at the end of 2024 to 74.4% a year later, as public warrant holders exercised into new shares [12]; dilution moved the number the wrong way for the family, not the right way. A 25.6% float cannot convene, block, or outvote anything.
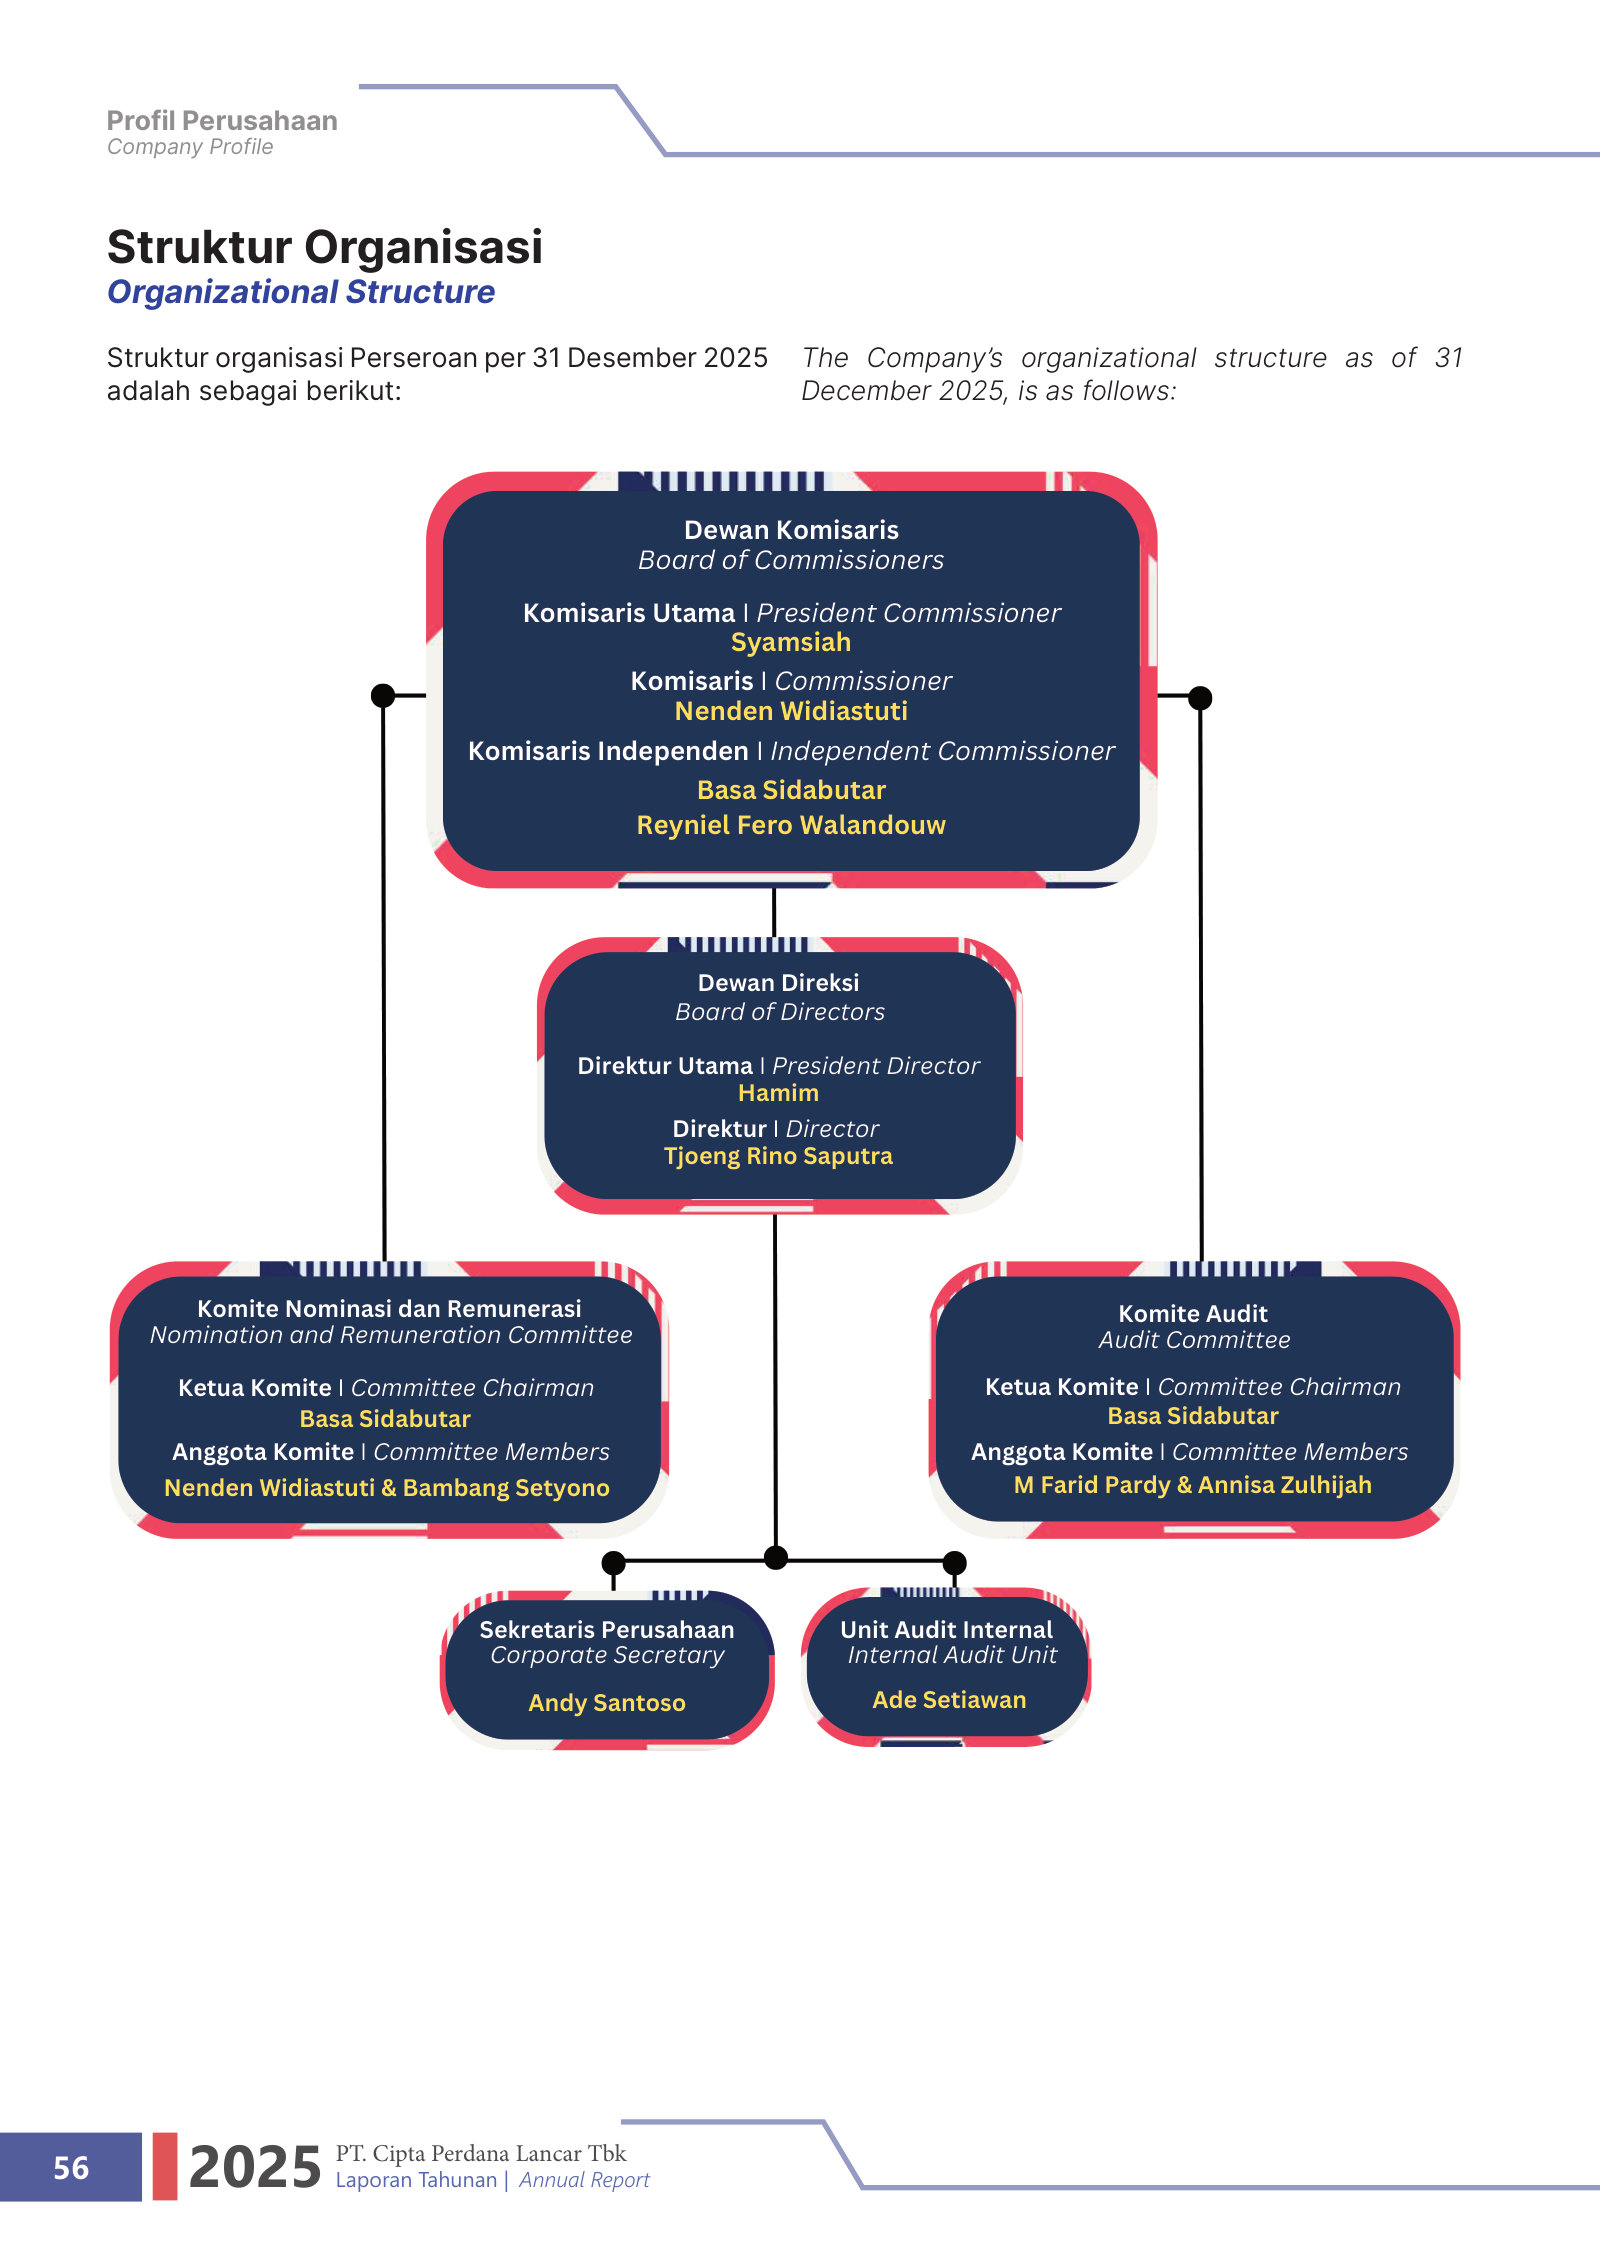
The board reflects the same arithmetic, with two mitigants. Indonesia runs a two-tier structure: an executive Board of Directors and a supervisory Board of Commissioners. The directors are Hamim and Tjoeng Rino Saputra; the finance, investment and human-resources brief sits with Saputra, a professional hire from the automotive-distribution industry with no disclosed family tie and no shares [13]. The four-member commissioner board is split evenly: Syamsiah and Nenden on the family side, and two independents — Basa Sidabutar, a former capital-markets regulator [14], and Reyniel Fero Walandouw, added in 2025 as the company broadened its business lines [15]. Two of the four commissioners are independent [16] — half the board, and above the one-third minimum Indonesian listing rules set. The qualification: both independents are appointed, and removable, by the family-controlled shareholder meeting. Their oversight is a genuine improvement on paper, but not a check the minority can compel.
How the family takes value
The ways an insider can pull cash out of a company are pay, dividends, and dealings with affiliated parties. On the first two, PART is restrained.
Aggregate remuneration for all six directors and commissioners was $0.17m in 2025, up from $0.15m in 2024 [17]. Against net profit, that is 9.3%, down from 10.2% the prior year — pay rose 19% while profit rose 30%. There is no equity or option plan, so management is not diluting the float through incentive compensation; the entire alignment runs through shares the family already owns. The company discloses only the combined figure, not amounts per person, which is the Indonesian norm but leaves the split between the founder and the rest unquantified.
Dividends flow pro-rata, so they reward the controller and the minority on the same terms. The maiden distribution declared in 2025 was $0.29m, 20% of 2024 profit [18]; of that, roughly $0.21m went to the family by virtue of its 74.4% stake, and the rest to the float. As Cash and Solvency set out, the payout is small next to the capital the business is still absorbing — but it is even-handed, which is the point here.
The strongest alignment fact is on the liability side, not the pay line. Every dollar of BCA bank debt — about $7.4m — is backed by a personal guarantee from Hamim for the full facility amount, and secured on land certificates held personally in Hamim's and Syamsiah's own names, alongside the company's machinery and receivables [19]. The controller's personal wealth is on the line for the company's solvency. For a business this thinly capitalized in cash, that is a more binding commitment than any pay policy.
The related-party channel, mostly closed
Related-party dealing is where value most often leaks in a controlled company, and it is where PART's record has genuinely improved. Before listing, the company was partly funded by its own affiliates: in 2023 it drew $1.6m from related parties and repaid $2.1m, and it still carried $0.6m of other receivables due from affiliates at that year-end [20], [21]. The IPO cash paid much of that down: affiliate inflows fell to $0.5m in 2024 and to essentially nil in 2025.
Source: FY2024 Annual Report, Statement of Cash Flows [22]; FY2025 balances per Note 29 [23].
By the end of 2025 a single related party remained: PT Usbersa Mitra Logam, an associate. Sales to it were $0.03m, 0.16% of revenue; a $0.12m loan facility the company had extended to it at 9% a year — a rate in line with what PART itself pays BCA — was fully repaid during 2025, leaving no affiliate receivable outstanding [24]. On the disclosed record, related-party activity is now immaterial and priced at arm's length.
Two caveats keep this from being a clean bill. First, the machinery for affiliate funding is recent and was large — the $1.6m–2.1m flows of 2023 are two years old, not ancient history, and nothing structural prevents them returning. Second, the disclosed related-party set is narrow: PART sits inside a family business group, and several of its largest third-party customers and suppliers carry the group's own naming — PT Kurnia Karya Perdana Lancar and PT Roda Prima Lancar among them [25]. The filings classify these as third parties; a reader cannot independently confirm the boundary. This is a monitoring point, not an allegation.
What is not protected, and what to watch
The read is that alignment currently outweighs extraction risk, and does so on hard evidence rather than assurances: a controller whose personal land and guarantee stand behind the debt, pay at 9% of profit with no dilution, and an affiliate channel narrowed to near zero. The counterweight is that none of this is structural. The float has no vote that matters, the independents serve at the controller's pleasure, and the same board that cleaned up the related-party book could reopen it.
One recent action underlines the point. After year-end, at a 6 January 2026 extraordinary meeting, shareholders authorized the directors to transfer, release, or pledge all or substantially all of the company's assets, and to act as guarantor for third-party financing [26]. In a company already running on one bank line and $0.18m of cash, a controller-approved mandate to encumber the whole balance sheet is a wide latitude, granted by a meeting the family alone decides.
What would change the read, in either direction: related-party balances or affiliate loans re-expanding toward their pre-IPO scale; board pay outgrowing profit or an equity plan appearing; or, on the other side, continued arm's-length discipline and the personal guarantee staying in place as the debt is refinanced. Each is a specific line in the next annual report — Note 29, the remuneration line, and the bank-loan collateral note — not a matter of judgment about intentions.
Demand and Durability
Figures converted from Indonesian rupiah at historical FX rates — see data/company.json.fx_rates. Ratios, margins, and multiples are unitless and unchanged.
PT Cipta Perdana Lancar sells into a large but essentially flat end market: Indonesian motorcycle sales held near 6.4 million units in 2025, barely changed from 6.23 million in 2023 [1]. Against that backdrop, the company's 38% revenue jump in FY2025 came only partly from its automotive core; most of it came from a metal household-products line that did not exist a year earlier. The earnings are real, but their durability rests on share gains and a new, unproven segment rather than a rising tide — and on a business that remains a fraction of the scale of its nearest listed peer.
A large end market that has stopped growing
The demand pool underneath PART is genuinely deep. Indonesia sold roughly 6.4 million motorcycles in 2025, within the industry's own 6.4–6.7 million projected range, and the cumulative two-wheeler population runs to hundreds of millions of units, sustaining a steady aftermarket for replacement parts [2] [3]. Automatic scooters make up more than 90% of unit sales [4].
Indonesia motorcycle sales, 2025 (m units)
Automatic-scooter share of sales
Electric two-wheeler share of sales
Source: FY2025 Annual Report, MD&A Macroeconomic Overview [5]. EV share stated as "below 1%".
What that pool is not is a growth market. Unit sales in 2025 were "relatively stable" against the prior year, and the 6.23 million figure the company cited for 2023 sits inside the same band [6] [7]. A metal-stamping supplier that grew revenue from $15.5m in FY2023 to $22.2m in FY2025 — roughly 55% over two years — did so while its core end-market volumes barely moved. That growth is therefore a share-and-diversification story, not a market-lift story, and it has to be assessed as one.
Management frames the headroom in its own terms: producing a motorcycle requires 800–900 distinct spare-part items, and the company puts its own coverage at about 0.3%, leaving "99.7% that can be taken" [8]. That is a statement of theoretical addressable parts, not of parts PART can win profitably against incumbent tier-one and tier-two suppliers; it is best read as ambition, not as a moat.
Where the FY2025 growth came from
The segment record makes the source of growth concrete. Of the $6.1m of revenue PART added in FY2025, $3.7m — about 61% — came from a metal-based household-products line (food trays and gas- and electric-powered oil-water frying machines) that recorded no sales at all in FY2024. The automotive core grew 15.3% and contributed a further $2.4m; electronics and sanitation together added under $0.1m [9].
Source: FY2025 Annual Report, Operational Review by Business Segment and Note 32 [10] [11].
Source: derived from FY2025 Annual Report segment sales, FY2025 vs FY2024 [12].
This cuts two ways. The optimistic read is diversification: management is deliberately building a non-automotive revenue base to reduce reliance on a single cyclical end-market, and the new line found $3.7m of demand in its first year [13]. The cautious read is concentration of a different kind: nearly two-thirds of the year's growth now depends on a consumer and food-service product with no track record, sold into markets — kitchenware, commercial fryers — where PART has no demonstrated position, pricing power, or channel. Whether $3.7m is a durable annual run-rate or a first-year surge tied to specific orders cannot be judged from a single year of disclosure; the next chapter, One Government Customer, resolves the line to a single buyer. It remains the item most worth watching in the next filing.
The segment note carries one further caveat. Gross margin is reported at almost exactly 19.15% for all four segments — automotive, electronics, sanitation and household alike [14]. Cost of goods is evidently allocated in proportion to sales rather than tracked to each line, so the note reveals the revenue mix but not the true economics of the new household segment. A reader cannot yet tell whether food trays and fryers earn the same margin as stamped automotive parts, or whether the uniform figure masks a lower-return business bought with price.
Electric-vehicle exposure
The transition to electric two-wheelers is frequently cited as a structural threat to Indonesian component makers. For PART, on the current evidence, it is a distant and largely mis-specified risk. Electric motorcycles remained below 1% of Indonesian sales in 2025, "still in its early stage despite ongoing government support" [15]. At that penetration, the near-term demand for internal-combustion parts is not materially eroding.
More important is what PART actually makes. Its products are metal components and sub-assemblies produced by stamping, welding, coating and assembly — structural and functional vehicle parts, brackets, and metal fittings [16] [17]. A scooter still needs a body, a chassis, and brackets whether its powertrain burns fuel or runs on a battery, so much of this work is powertrain-agnostic. The honest bound on that read is that PART does not disclose how much of its automotive revenue is tied to engine, exhaust, or fuel-system parts that an electric drivetrain would delete; if such parts exist, they are exposed. But nothing in the product description points to engine internals as the core of the business.
The pressures that are live today are more prosaic than EVs: the cost of steel, aluminium and plastic resin, which the company names as the swing factor in its cost structure, and a softening four-wheel market that its larger peer flags directly [18] [19]. Input-cost inflation matters more to a 19% gross-margin stamper over the next two years than a battery transition that is barely visible in the sales data.
A small supplier, benchmarked
On scale, PART sits far below its nearest listed peer. PART's closest listed analog, PT Dharma Polimetal (DRMA) — a stamped-metal component maker that is also one of PART's own customers — is an order of magnitude larger and converts its profit to cash in a way PART does not [20] [21].
Sources: PART FY2025 Annual Report, Note 32 and financial statements [22]; DRMA FY2025 Annual Report, Financial Highlights [23] [24].
DRMA books $356.4m of revenue and $39.9m of net profit — roughly 16 times PART's revenue and 22 times its earnings — at a 20.9% return on equity [25] [26]. On gross margin the two are close — PART's 19.2% actually edges DRMA's 18.0% — so at the level of the stamping operation itself, the small company holds its own on price and cost. The gap opens further down. DRMA earns a higher net margin (11.2% vs 8.2%) with the help of associate income and scale, and it generated $55.4m of operating cash on $39.9m of profit — a 1.39x conversion — while PART converted just 0.51x, the shortfall documented in Cash and Solvency [27]. A larger competitor turning the same kind of parts into cash at nearly three times PART's rate indicates that PART's cash problem is company-specific, not an industry given.
On the moat itself, the measured read is narrow-to-none. PART has real qualification assets — ISO 9001 certification, a two-decade Astra-ecosystem relationship, and tier-one status with Panasonic and Isuzu since 2018 — and tooling and moulding investments that raise a customer's switching cost once a part is designed in [28]. But it remains a sub-scale tier supplier of commodity stamped metal, one of several IDX-listed metal formers serving the same customers, and it sits below DRMA in the chain — DRMA is a customer, carrying a $0.16m receivable at year-end [29]. Its advantage is execution and proximity, not structural pricing power.
Customer concentration, at least, is not an added worry. The trade-receivables ledger spreads across a dozen third-party names — the largest, PT Kurnia Karya Perdana Lancar, at $0.31m — with no single customer dominating, and management states there is "no significant concentrated credit risk" [30] [31]. The one qualification is that PART's single largest receivable carries the family group's "Perdana Lancar" naming, a related-party boundary examined in Alignment and Control.
What would change the read
On balance, the earnings look moderately durable but not secure. The automotive base sits on a deep, stable demand pool and is well insulated from the EV transition on a five-year view; against that, the market is not growing, the reported growth leans on an untested new segment, and the company earns its keep as a small price-taker in a field led by a peer sixteen times its size. Two observations would move the assessment. If the household-products line holds or builds on its $3.7m in FY2026 and the segment note begins to show its true margin, the diversification thesis strengthens and the growth looks repeatable. If that line fades toward zero, or if steel and resin costs compress the 19% gross margin, the durable core shrinks back to a flat-market automotive stamper — profitable, aligned, but neither growing nor generating cash. External corroboration of the industry figures could not be added here; web research was unavailable at the time of writing, so the market data rests on the company's own AISI-sourced disclosures and the peer filing.
One Government Customer
Figures converted from Indonesian Rupiah at historical FX rates — see data/company.json.fx_rates. Ratios, margins, and multiples are unitless and unchanged.
PART's FY2025 earnings step-up leans on a single buyer. PART's new metal-household segment ($3.7m, 61% of FY2025 revenue growth) is one government customer, Badan Gizi Nasional, whose FY2025 order matches the segment total to the dollar and carries no contracted recurrence. [1][2] That $3.7m is 16.8% of FY2025 revenue, and the account sold nothing before 2025. What it means for forward earnings turns on whether it repeats: on the bear path in Scenarios and Watch Items, the household line reverts to about $0.30m, FY2025's $22.2m of revenue falls to roughly $20.2m and profit to around $1.38m — a 12.6x multiple at the 17 July 2026 price of $0.0059 — so close to a fifth of FY2025 revenue and a quarter of its profit rest on one uncontracted account. Management reads it the other way: it describes the food-tray business as continuous rather than tender-based, and the national kitchen network it supplies is still being built out. That is a general business-model statement, not a documented commitment that this particular order recurs, and the FY2025 record does not yet settle which read holds.
From zero to $3.7 million
The metal-household products line — food trays and gas- and electric-fired oil-water frying machines — went from no sales in FY2024 to $3.7m in FY2025, arriving as a fourth reporting segment alongside automotive, electronics and sanitation [3]. Total revenue rose 38.2% to $22.2m; of the $6.1m added, $3.7m (61%) came from this new line, $2.4m from a 15.3% lift in the automotive core, and the rest from everything else [4]. The automotive franchise still supplied 80% of sales, but it was not what moved the year.
Source: FY2025 Annual Report, MD&A — Operational Review by Business Segment [5].
The strategic rationale management gives is diversification — expanding revenue streams and reducing reliance on cyclical automotive demand, with "sustainable growth opportunities" from the culinary and food-service market "both in terms of sales volume and market expansion" [6]. The evidence in this chapter is about how much of that is demonstrated and how much is aspiration.
One customer, one programme
The customer note resolves what the segment table leaves open. Note 24 lists every customer above 10% of revenue, and the metal-household line maps to exactly one: Kantor Pusat Badan Gizi Nasional at $3.7m — the same figure as the household segment total [7]. The new segment is not a diversified consumer book; it is a single account. The only other 10%-plus customer is PT Chemco Harapan Nusantara, a long-standing automotive brake-systems buyer, at $2.5m. Together the two represent $6.2m, or 28% of FY2025 sales [8].
Source: FY2025 Annual Report, Note 24 (customers above 10% of revenue); "all other" derived as the residual to reported total revenue [9].
Badan Gizi Nasional is the agency running Makan Bergizi Gratis, the national free-nutritious-meals programme that is the flagship of the Prabowo administration. PART's own materials tie the food-tray line directly to it: stainless-steel (SUS304) trays at 0.4mm gauge, made from locally sourced Morowali nickel-steel, which management flags as a "materially higher per-piece revenue contributor" [10]. Indonesian business press through July and August 2025 framed the entry the same way — the company "entering the food-container business to target Prabowo's MBG programme," and by March 2026 called the programme PART's "new engine" of growth [11]. The programme is large and well-funded — a 2026 budget around $20bn and roughly 28,000 meal-preparation kitchens — so the first-year demand was real, not an accounting entry. What a peer-priced multiple pays for earnings this concentrated is taken up in Margin of Safety; this chapter takes up whether those earnings persist.
A mid-year build-out
The timing of the order carries information. First-half 2025 revenue was $8.5m, up just 3.7% year on year, with net profit of $0.5m [12]. The full year came in at $22.2m and $1.8m [13]. The second half therefore carried $13.6m of revenue and $1.3m of profit — 62% of the year's sales and 72% of its profit — compressed into roughly the last five months.
Source: H1 2025 figures per interim results reported in Indonesian financial press [14]; full-year figures per FY2025 Annual Report [15]; half-year splits derived by subtraction.
That burst was not in the plan. The formal FY2025 targets management set for itself were a 20% rise in net sales and 15% growth in household and sanitation products combined — modest numbers consistent with the existing book [16]. The company then pivoted mid-year: an Extraordinary General Meeting on 11 August 2025 approved the household expansion, additional working-capital financing and the purchase of new machinery, backed by a fresh $4.4m BCA credit facility and twelve food-tray machines installed at the Tangerang plant [17][18]. The supply chain shifted to match: three suppliers that billed nothing in FY2024 — PT Tri Cipta Teknindo ($1.3m), Aspire Tech ($1.1m) and PT Nikawa Teknika Indonesia ($1.1m) — together supplied $3.5m of purchases in FY2025 [19]. And finished-goods inventory rose from $0.3m to $2.5m over the year, the working-capital swing examined in Cash and Solvency [20].
A single account, filled in one half-year, requiring dedicated machines, a new credit line and new suppliers, then leaving a large finished-goods position behind, has the shape of an initial fit-out rather than a level, repeating order stream.
The recurrence question
Management's framing points the other way, and it deserves a fair hearing. At the June 2025 public expose, the founder-CEO described the business model as continuous rather than tender-based — "not like a tender, won once and finished, but ongoing, with offers every month on a regular basis" — and placed the food-tray project inside that model as a large per-piece revenue addition [21]. The annual report echoes it, citing "sustainable growth opportunities" and both domestic and export ambition for the line [22]. Two structural points support a recurring read: food trays are per-student consumables that break and require replacement as the programme scales its beneficiary base, and the kitchen network the programme is building out is far from complete, so new-kitchen equipment demand continues while it expands.
The FY2025 record, though, does not yet corroborate that recurring read, and several facts cut against it. The order is a single government account with no purchasing history before 2025, delivered in one concentrated burst — the profile of procurement, not of a recurring commercial supply relationship, whatever the general business-model description. Nothing in the corpus discloses a multi-year contract, framework agreement or committed reorder schedule; recurrence is asserted, not documented. The same management framing accompanied a public revenue target of $60m for 2025 that the company missed by more than half, delivering $22.2m [23][24], which argues for weighting the record over the ambition. And the frying-machine portion of the line is capital equipment, one unit per kitchen — genuinely one-time.
On balance, the evidence leans toward the Badan Gizi contribution being a front-loaded, largely one-time fit-out rather than a proven annual franchise, with the tray-replacement and programme-expansion channels a real but unquantified offset. The strongest fact against that read is management's explicit recurrence framing and the still-expanding kitchen network; the strongest fact for it is the single-customer, single-burst, unplanned, uncontracted shape of the FY2025 order. Two disclosures would decide it, both outside the current corpus: whether the FY2026 Note 24 shows Badan Gizi (or another programme buyer) recurring as a 10%-plus customer at comparable scale, and whether H1-2026 revenue holds the second-half-2025 run-rate rather than reverting toward the ~$8.5m first-half-2025 pace. The early-2026 signals gathered in Margin of Safety point to softening rather than repetition, but on one unaudited quarter.
Figures converted from Indonesian rupiah at historical FX rates — see data/company.json.fx_rates. Ratios, margins, and multiples are unitless and unchanged.
Earnings Quality
FY2025 net profit rose 30%, but every margin line thinned: gross margin fell from 21.9% to 19.2%, operating from 11.7% to 11.0%, net from 8.7% to 8.2% [1]. The growth was volume, concentrated in a single fourth-quarter government-order burst that carried a below-average 16.8% gross margin [2]. The audited segment note allocates cost pro-rata, so all four product lines show an identical 19.15% margin — a mechanical split, not a measurement [3].
Profit grew on volume, not margin
Revenue grew 38.2% in FY2025 and net profit 30.0%, but the two do not tell the same story about profitability. Cost of sales rose 43.1% — faster than revenue — so gross profit grew only 20.9% and the gross margin gave back 2.7 percentage points [4]. Operating expenses were the one line that scaled well, up just 10.6% against 38% more revenue [5]; that operating leverage cushioned the fall but did not reverse it, and operating and net margins slipped as well.
Gross margin FY2025
▼ -2.7% vs FY2024 (pp)
Operating margin FY2025
▼ -0.7% vs FY2024 (pp)
Net margin FY2025
▼ -0.5% vs FY2024 (pp)
Source: FY2025 Annual Report, Financial Performance Review [6]; Note 32 Operation Segment totals [7].
Source: derived from the FY2025 Annual Report income statement, FY2024 and FY2025 [8].
Management attributes the higher cost of sales partly to rising metal raw-material prices alongside the volume increase [9]. That matters for how the compression is read: input-cost inflation can reverse, whereas a permanent shift toward lower-margin volume does not. The filings do not let those two causes be separated cleanly, but the timing within the year narrows the question.
The compression is concentrated in the back half
The interim filings report revenue and gross profit on a cumulative basis — three months, six months, nine months, then the full year — so each quarter can be recovered as the difference between successive periods [10] [11] [12] [13]. Doing so exposes what the annual total averages away: the fourth quarter was 39.5% of the year's revenue in a single three-month stretch, and it was the lowest-gross-margin quarter of the four at 16.8% — below the full-year 19.2% and well under the third quarter's 24.4%.
Source: derived from PART interim and audited statements, Q1–Q4 FY2025 (each quarter = successive cumulative periods) [14] [15].
Source: derived from PART interim and audited statements, Q1–Q4 FY2025 [16] [17] [18] [19].
Two features stand out. First, the gross margin swings across a nine-point band within a single year — 15.9% to 24.4% — which is wide for a contract stamper and reads as project-shaped economics rather than a steady OEM order book. The government food-tray order (One Government Customer) landed almost entirely in the second half and coincides with the largest, lowest-margin quarter. Second, the profit still grew because operating expense stayed close to fixed: the half-year operating margin was 13.0% in the second half against 7.7% in the first, so the volume surge dropped through to operating profit even as the gross margin on that volume was thinner. The earnings step-up is genuine leverage on a revenue spike, not a widening of unit economics.
The segment note allocates the mix away
Note 32's uniform pro-rata cost allocation is uninformative about the government order's standalone margin. The note splits the income statement across the four product segments, but the cost of goods sold is allocated so that every segment lands on an identical 19.15% gross margin — automotive, electronics, cleaning facilities, and the new household line alike [20]. The prior year shows the same fingerprint, with all segments at 21.89% [21]. A uniform margin across four unrelated product lines is an allocation convention, not an observation, so the note reveals nothing about whether the $3.73m government order was won at, above, or below the automotive base.
Source: FY2025 Annual Report, Note 32 Operation Segment [22]; household segment total ties to the Badan Gizi Nasional customer in Note 24 [23].
With the segment note uninformative, the consolidated quarterly progression is the only window onto the order's economics, and it points to below-average gross margins on the incremental volume — while leaving open how much of that is mix versus the metal-cost inflation management cites. Two further quality markers reinforce that the reported profit deserves a discount rather than a premium: roughly 23% of FY2025 pre-tax profit came from non-core scrap and other income rather than the manufacturing operation (Cash and Solvency) [24], and the external auditor changed between the two years — from Gideon Adi & Rekan for FY2024 to Kanaka Puradiredja, Suhartono for FY2025 — with both issuing unmodified opinions [25]. The auditor rotation is not by itself a red flag, but it coincides with the year of margin compression and the inventory build.
What would settle it
The read here is that FY2025's $1.81m profit is real but flattered: margins thinned at every line, the growth was volume concentrated in one lower-margin quarter, and the audited segment note allocates the mix question away rather than answering it. The strongest fact against a cautious read is the operating leverage — if the higher second-half volume holds, near-fixed operating expense keeps dropping through, and the cost-of-sales pressure management flags could ease with metal prices. The FY2026 filings decide between the two: a gross margin recovering toward 21% would mark the FY2025 compression as transitory input-cost pressure and the earnings base as durable; a margin holding near 19% or falling further, especially if the government order does not repeat at scale, would mark FY2025's blended margin as a ceiling rather than a floor. The quarterly gross-margin path and Note 24's customer list are the lines to read first, because the profit the market is capitalising (Margin of Safety) is a volume peak with thinning unit economics, not a step-change in profitability.
Margin of Safety
Figures converted from Indonesian rupiah at historical FX rates — see data/company.json.fx_rates. Ratios, margins, and multiples are unitless and unchanged.
At $0.0059, PART trades at roughly 9.6x trailing earnings, 1.6x book and 5.6x EV/EBITDA — a market value near $16.3m, well below its February 2026 peak. In absolute terms that reads as modest. Measured against the market multiples of its listed Indonesian peers it sits at the top of the range, and roughly 17% of the earnings being capitalised came in FY2025 from a single government-programme customer. The discount that a margin-of-safety buyer is looking for is not clearly on the page.
What $0.0059 buys
The share closed at $0.0059 on 17 July 2026, essentially back to the $0.0065 IPO price of two years earlier. With 2.74 billion shares outstanding [1], that is a market value of about $16.3m. FY2025 net profit was $1.81m on revenue of $22.2m [2], equity was $11.1m [3], and the company reported an 18.8% EBITDA margin [4] — about $4.17m of EBITDA. Net of $5.77m of net debt, enterprise value is near $22.1m.
Market Value ($m)
Trailing P/E (x)
Price / Book (x)
EV / EBITDA (x)
Sources: derived from FY2025 net profit and equity [5][6], share count [7], and the 17 July 2026 close of $0.0059 (market data).
The plainest read of those numbers: a buyer at $0.0059 earns roughly a 10.4% earnings yield on FY2025 profit, and is paying about 1.6 times a book value that itself earned a 16.3% return on equity in FY2025 [8]. Income is thin: the maiden dividend, declared on FY2024 earnings, was $0.0001 per share — a total of $0.28m, or 20% of that year's profit [9]. At $0.0059 that is a 1.6% yield; a repeat 20% payout on FY2025 profit would lift it to about 2.1%. A company retaining most of its earnings to fund an inventory build (Cash and Solvency) is not, at this price, an income holding.
A price round-trip, not a bargain-basement collapse
The price is back near where the shares listed, but that round-trip mostly unwound a speculative spike rather than opening deep-value territory. Listed at $0.0065 in July 2024, the shares drifted through 2025, then ran to an intraday high of $0.0126 on 19 February 2026 — more than double the IPO price — before collapsing to an intraday low of $0.0038 on 8 June 2026 and recovering to $0.0059. On a 25.6% public float, that is the price behaviour of a thinly-traded micro-cap, not a re-rating driven by fundamentals.
Source: month-end closing prices, IDX market data (Yahoo Finance / StockAnalysis), converted at contemporaneous FX rates; IPO price $0.0065 on 5 July 2024. Intraday high $0.0126 (19 Feb 2026) and low $0.0038 (8 Jun 2026) exceed the month-end range shown.
The distinction matters for a margin-of-safety buyer. A price back at the IPO level is not, by itself, cheap; it is cheap only if the business is worth more than it was at listing and the market has stopped paying for that. Whether that holds depends on the two things the rest of this report has weighed — the durability of the earnings, and the fragility of the balance sheet that supports them.
Against the peer group, it is not cheap
The most useful anchor is the handful of listed Indonesian metal-and-auto-component makers that trade on the same exchange. On a trailing P/E of about 9.6x, PART sits at the top of that range — above Astra Otoparts (AUTO, roughly 5.8x) and its closest analog Dharma Polimetal (DRMA, roughly 7.0x), and level with the highest-quality name, Selamat Sempurna (SMSM, roughly 9.0x).
Sources: PART figures derived from FY2025 filings [10][11]; DRMA revenue and cash conversion from its FY2025 report [12] and 20.9% ROE [13]; peer P/E and dividend yields per current market data (Yahoo Finance / Investing.com, 2026). Blank cells not sourced.
The comparison with DRMA is the sharpest. Both trade at 1.57x book — but DRMA earned a 20.9% return on that book against PART's 16.3% [14][15], converted operating cash at 1.39x net profit against PART's 0.51x (Cash and Solvency), and is sixteen times larger [16]. Paying the same multiple of book for a lower-returning, cash-shorter, sub-scale supplier is the opposite of a discount. On income the gap is wider still: AUTO and SMSM yield 7–8%; PART yields under 2%, because it needs its cash for working capital and its BCA facility (Cash and Solvency).
For an investor whose stated rule is to avoid expensive stocks, PART is fully valued on its own corpus figures (9.6x earnings, 1.6x book) and full-to-premium against the external market multiples of its cheaper listed peers, not a peer discount.
The quality of the earnings being capitalised
A P/E multiplies a number; the number has to be durable for the multiple to mean anything. The FY2025 profit line carries a concentration that the peer comparison does not capture. PART's new metal-household segment ($3.73m, 61% of FY2025 revenue growth) is one government customer, Badan Gizi Nasional, whose FY2025 order matches the segment total to the rupiah and carries no contracted recurrence. [17] That is 16.8% of FY2025 revenue capitalised at 9.6x, from an account with no purchase history before 2025; whether it recurs, and what that would mean for forward earnings, is the question worked through in One Government Customer.
What would change the read
The case is genuinely two-sided, and most sensitive to how durable the FY2025 earnings behind the 9.6x multiple prove to be.
The bull read is that single-digit earnings, 1.6x book, a 16% ROE and genuine 55% two-year revenue growth (Cash and Solvency) are not a demanding price for a founder-controlled company still taking share; at $0.0059 the market has already discounted the February enthusiasm, and if the household line recurs and cash conversion normalises, today's price capitalises a growing business cheaply.
The bear read — the one the evidence leans toward — is that the multiple is roughly a peer multiple applied to earnings inflated by a non-recurring, single-customer government order, on a balance sheet with $5.8m of net debt, a founder guarantee and near-zero spare cash (Cash and Solvency). Strip an aggressive share of the Badan Gizi revenue and the forward multiple is meaningfully higher than 9.6x, on a company whose downside is bounded by covenants rather than net cash.
Three checkable items would settle it. First, the FY2026 disclosure of Badan Gizi Nasional revenue in the next Note 24 — recurrence at or near $3.7m confirms a franchise; a sharp drop confirms a one-off. Second, operating cash flow against net profit in FY2026: a return toward 1.0x would show the earnings are real cash, not inventory. Third, the multiple itself relative to peers: a de-rating toward DRMA's 7x or AUTO's 5.75x, without a deterioration in the business, is where a margin of safety would actually appear. For an investor who requires a near-zero chance of bankruptcy and a large discount, the price today offers neither the balance-sheet comfort nor the peer discount that would clear that bar.
Scenarios and Watch Items
Figures converted from Indonesian rupiah at historical FX rates — see data/company.json.fx_rates. Ratios, margins, and multiples are unitless and unchanged.
The earlier chapters established the pieces separately — the fragile balance sheet (Cash and Solvency), the aligned but unchecked controller (Alignment and Control), the flat end-market and unproven new line (Demand and Durability), the full-to-premium price (Margin of Safety), and the single government order behind the growth (One Government Customer). Reconciled, they resolve into one correlated risk rather than three independent ones. The bear case and the refinancing wall are one event: a FY2026 in which the Badan Gizi order does not recur is also the year the $2.53m inventory does not convert, even as ~$1.45m of BCA debt matures against $0.17m of cash. [1][2][3][4] The order at risk is about 16.8% of FY2025 revenue; the $2.53m finished-goods position is roughly 23% of equity and carries no obsolescence provision; and cash covers the maturing debt only about 12%. The mitigant sits in the same treatment: the founder personally guarantees the full BCA facility on family land [5], and BCA has rolled and expanded these lines before, so the correlated risk is bounded by the controller's own wealth rather than by net cash. PART's next-year earnings turn mostly on two measurable things: whether the $3.7m government food-tray order recurs, and whether reported profit converts to cash again. Around those pivots the plausible range runs from a low-double-digit multiple on a shrinking base to roughly 7x on a scaling franchise. The binding constraint throughout is a single-lender refinancing wall, not the income statement.
The two pivots that move the outcome
The case is most sensitive to two things the FY2026 filings will answer.
The first is the metal-household line. It went from zero to $3.73m in FY2025 and supplied 61% of the year's revenue growth [6], and Note 24 shows the entire segment is one buyer — Kantor Pusat Badan Gizi Nasional, the National Nutrition Agency behind the Makan Bergizi Gratis free-meals programme — whose $3,726,629 order matches the segment total to the dollar [7]. With automotive customer PT Chemco ($2.49m), the top two accounts were 28% of FY2025 sales [8]. Whether that order was a one-time kitchen fit-out or the first year of a recurring supply relationship is genuinely two-sided, and it swings roughly a fifth of revenue.
The second is cash conversion. FY2025 turned $1.81m of reported profit [9] into only $0.93m of operating cash — a 0.51x conversion [10] — because finished-goods inventory rose to $2.53m [11]. If that stock is staged deliveries, it converts in FY2026 and cash normalises; if it is speculative production for an order that does not repeat, it is where a write-down would land. The two pivots are linked: the same government order drives both the revenue and the inventory.
Base, bull and bear
The three paths below are illustrative, not forecasts — PART has no analyst coverage and publishes no guidance, so these are built from the FY2025 segment structure and stated assumptions, holding the share count and the $0.0059 price fixed. The scenarios differ almost entirely in one input: the household line.
Source: analyst scenarios derived from FY2025 segment disclosures [12] and the profit and loss statement [13]; assumptions stated below.
Source: analyst scenarios; base figures from FY2025 segment note [14] and profit and loss [15]. P/E computed at the 17 Jul 2026 price of $0.0059.
The bear path assumes the fit-out was one-time: the household line all but disappears as the initial kitchen equipment is delivered, automotive grows a modest 8%, and the loss of high-utilisation government volume compresses margin toward the run-rate the first post-order quarter implied. Revenue falls about 9% to roughly $20.2m and profit to around $1.38m, so the same $0.0059 price is a ~12.6x multiple on a shrinking base — the opposite of a value entry. This path is not a tail: an interim data point after the order shipped annualised earnings well below the FY2025 figure, consistent with mix reverting once the burst is gone (one unaudited quarter, outside the filing corpus).
The base path assumes partial recurrence — tray replacement and continued kitchen additions at roughly half the FY2025 rate — with automotive up 10%. Revenue holds near $22.1m and profit near $1.74m, leaving the stock around 10x. Here cash is the story that improves: if the $2.53m finished-goods position converts and capex steps down from the $4.32m FY2025 build toward the $1.08m depreciation run-rate, free cash flow moves toward breakeven for the first time in three years.
The bull path assumes the household line is a franchise, not a fit-out: the free-meals kitchen network keeps scaling nationally, PART wins repeat and expanding volume to roughly $5.4m, and automotive grows 15%. Revenue reaches about $26.6m and profit about $2.40m, putting the stock near 7x with cash conversion normalising as growth capex tapers. This is the path that would retroactively justify treating FY2025 as a base rather than a peak.
The scenarios are most sensitive to the single household input; the automotive assumptions move the answer far less. That is the concentration risk restated as arithmetic.
The constraint that outranks the income statement
For a reader whose first requirement is a near-zero chance of bankruptcy, the scenarios above are secondary to a balance-sheet fact. PART carried $7.40m of bank debt at end-2025, all with one lender, Bank Central Asia, and roughly $1.45m of it — a $0.14m short-term line plus $1.31m of current maturities — falls due within a year [16]. Against that sits $0.17m of cash [17] — about 12% cover — and $11.1m of equity [18].
Bank debt due within 1yr ($M)
Cash ($M)
Cash cover of near-term debt
Net debt / EBITDA
Source: FY2025 Annual Report — bank loans [19] and financial position [20]; ND/EBITDA computed on full bank debt.
Two facts pull in opposite directions. Against the fragility: the founder personally guarantees the full BCA facility and family land secures it [21], so the controller's own wealth is exposed to a default and strongly motivates timely refinancing, and headline leverage at about 2.0x net-debt-to-EBITDA is not extreme. For the fragility: cash covers only a fraction of what rolls each year, the company has been free-cash-flow negative for three straight years, and a January 2026 shareholder meeting authorised the directors to pledge substantially all company assets and act as guarantor [22]. The honest read is that default risk is low but not negligible, and it is a refinancing risk, not a leverage-ratio risk: solvency depends on BCA continuing to roll roughly $1.45m a year while the business is not self-funding. The refinancing wall and the bear scenario are the same FY2026 outcome, set out at the top of the chapter.
What to watch
Each item below is a specific line in a specific future filing, with the threshold that would move the read. The first two settle the pivots; the rest bound the balance-sheet risk.
Source: watch items defined by the analyst against FY2025 disclosures; each resolves in the FY2026 interim and annual filings.
Reconciling against a value lens
Set against a buyer who wants a wide margin of safety, a founder with real skin in the game, and near-zero bankruptcy risk, the pieces land unevenly. The alignment test passes cleanly: the founder guarantees the debt with personal assets and pay is modest. The margin-of-safety test does not clear as easily — at $0.0059 the stock sits at the top of its listed peer range rather than at a discount, so a buyer is paying a full peer price for earnings that lean on an unproven order. And the bankruptcy test is the one that most resists a confident answer: the business is solvent on ratios but thin on cash and dependent on one bank's willingness to keep lending.
The evidence points to a company whose FY2025 result was flattered by a single government order and whose safety rests on refinancing rather than self-funding; the read that would overturn that is a FY2026 in which the household line recurs at scale and cash conversion returns to 1.0x. Both are checkable within a year, in the filings named above, which is the useful place to leave it.